School data you can cite — every figure traceable to the source
Open, machine-readable data with full traceability. All sources documented, all measures defined. Terms are source-specific — see the source and licence matrix.
65+Visualisations
11Data stories
19Datasets
For newsrooms: data, graphics and contact
Neutral material for your own editorial work — we provide data and tools, not conclusions. Municipal and independent school operators are presented on equal terms.
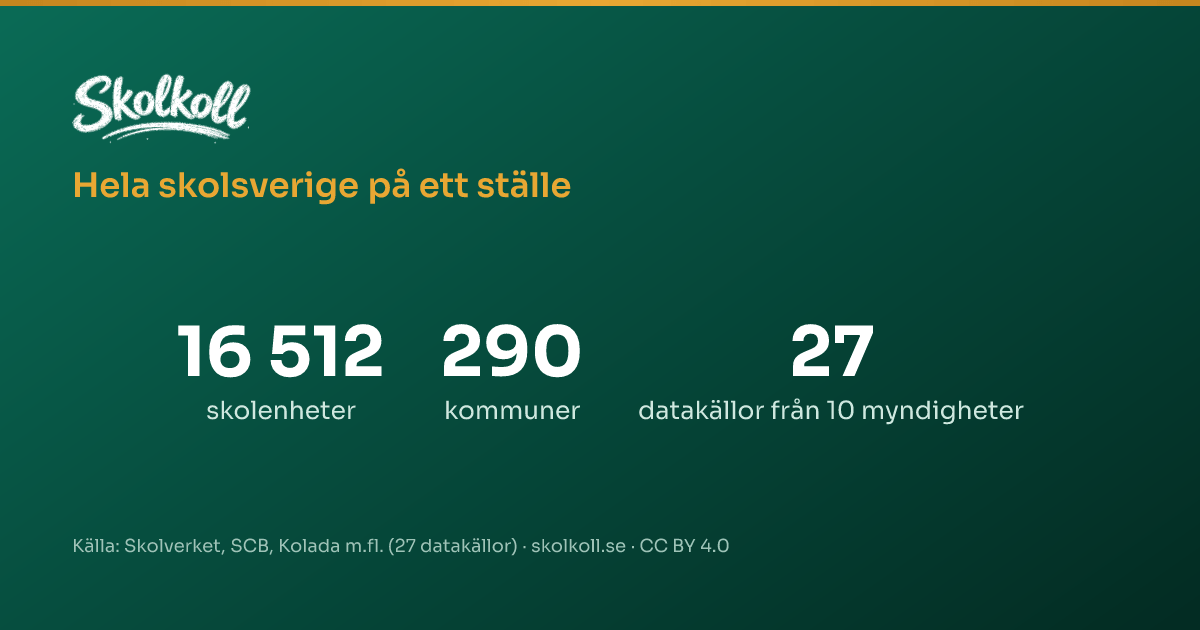
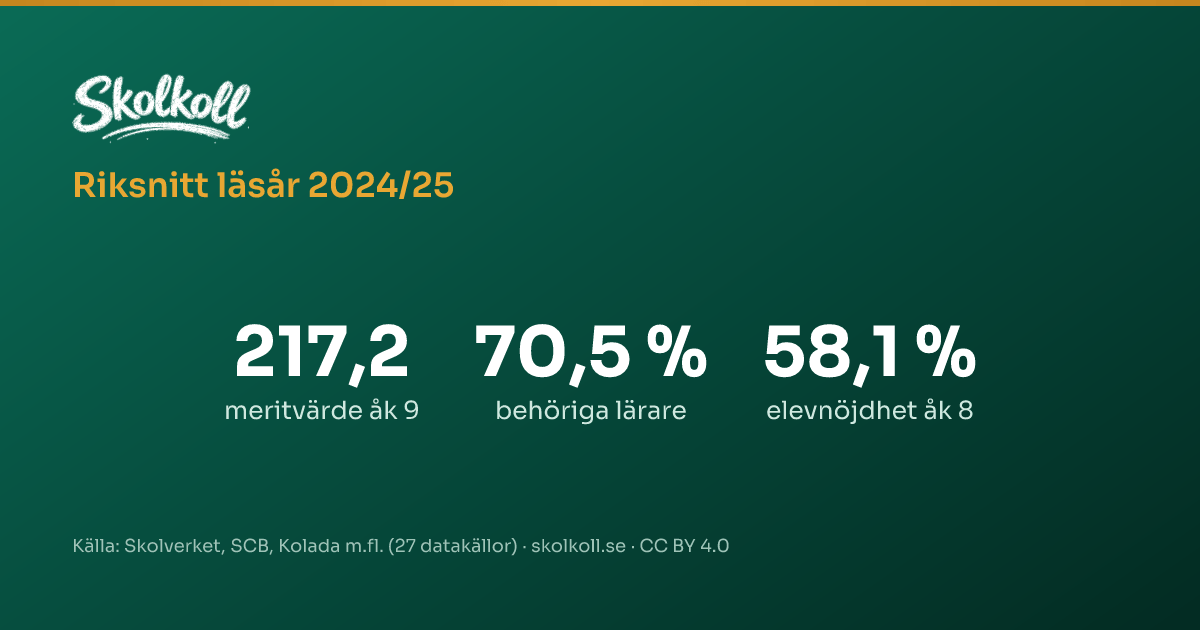
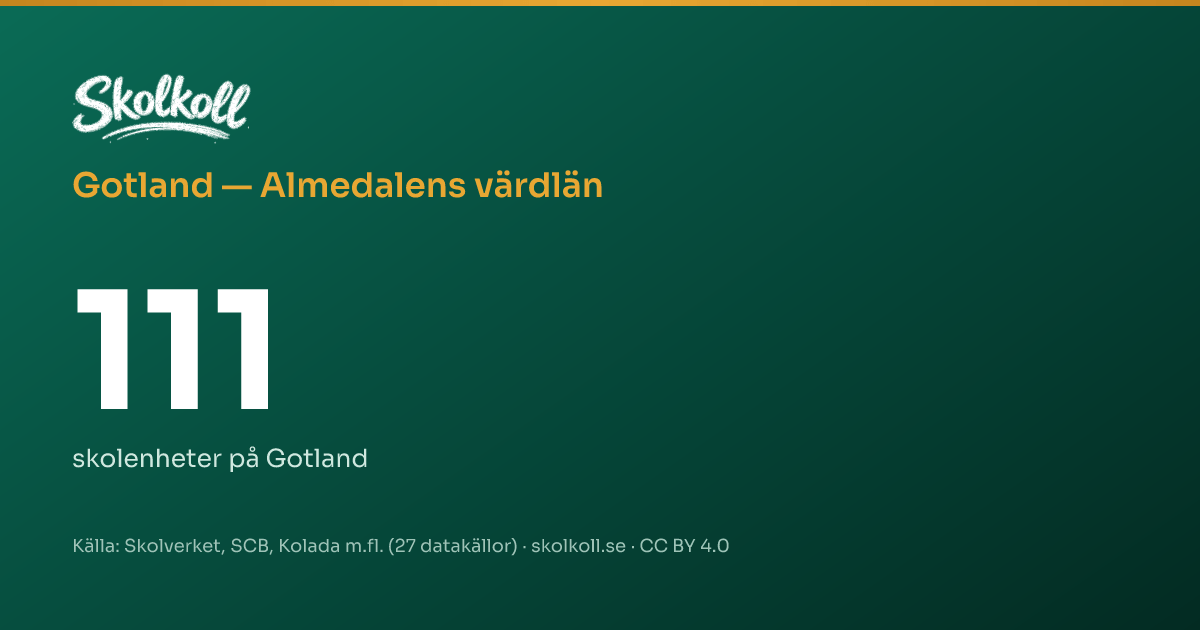
Ready-made data cards and logos (CC BY 4.0) — credit Skolkoll. The licence covers the images; the underlying data follows source-specific terms and is not sublicensed generally. More formats and text templates are included in the press kit.
We comment on data and method, never parties. Skolkoll can help with source rows, definitions, methodological boundaries and reproducible extracts, but does not write campaign material or assess party proposals.
What Skolkoll can and cannot comment on
We can comment on
We do not comment on
Sources, definitions, comparability and uncertainty
Parties, candidates, campaign strategy or political blame
How a data extract can be reproduced
Ready-made political conclusions from a figure
What PISA, merit values and municipal measures actually measure
Which party benefits or loses from a result
Press Q&A
For rapid fact checks: send the link, screenshot, source row and question to info@skolspegeln.se. Short standard answers are included in the press kit.
For transparency: my day job is at AcadeMedia, Sweden's largest independent education provider. Skolkoll is operated and developed by Skolspegeln AB (org. no. 559359-7288) — without resources, direction or influence from my employer.
PISA 2025 on 8 September 2026
For Skolverket's PISA 2025 presentation, Skolkoll is preparing an explainer, data cards and methodology comment on Sweden in PISA. The target is an initial data-and-method comment within 2 hours of publication.
Neutral story leads
Neutral data entry points and where to find them on Skolkoll
Are you a journalist who needs a data extract, a source reference or a custom cut? Tell us what you need and we'll get back to you.
Pilot status
Design partner, not a customer claim: Journalist Pro is not a finished direct-purchase product and starts through interest registration or quote.
Source data
Server-verified source references from open school data, with clear marking when data is not enough to support a conclusion.
Data boundary
No individual data, no personal identity numbers and no student names are included in the pilot workflow.
Pilot chain from signal to publishable story package
The target workflow moves from verified news signal to story package in under 10 minutes without new newsroom data infrastructure.
News signal
Start with a watchlist for a municipality, county, provider or topic and see which open indicators are moving.
Story card
Gather hypothesis, counter-questions and affected schools in a card the newsroom can review before publication.
Evidence package
Link the source row, method note and comparison values without AI-generated conclusion text.
Chart-ready CSV
Export aggregate tables with metadata and citation line for charts, fact boxes or internal research.
Journalist Pro
Starts through interest registration or quote
The pilot package is matched to the newsroom's coverage areas, publishing cadence and evidence-package needs. There is no public checkout for Journalist Pro.
Refresh: Quarterly: update certification rankings, compare with the previous quarter and highlight municipalities crossing the 60 or 80 percent thresholds.
Story starter
Independent school groups' results profile
Track organisers with large pupil volumes, growing market share and results that deviate from expectations.
Refresh: Quarterly: update the admissions file, compare admissions scores across years and check programme codes.
Story starter
Methodology for theme packages
Key measures used in the theme packages above.
Merit score year 9
Definition
Average merit score for year 9 students. Calculated as the sum of the 16 best grades (max 320 points, 340 with modern languages), where each grade gives 0–20 points.
The share of teachers (in full-time equivalents) who hold a Swedish teaching licence (lärarlegitimation) and are qualified to teach, where qualification covers the school type, subject and, in compulsory school, the grade band of the teaching they do.
Raw merit values reflect pupil composition more than school quality. Use SALSA-adjusted values for fair comparisons.
Ignoring pupil count
Small schools have large statistical variation. Always check pupil count — a school with 15 pupils can swing 30 points between years.
Mixing school types
Compulsory and upper secondary schools are measured with different metrics. Make sure you compare within the same school type.
One year as a trend
At least 3 years of data are needed to identify trends. Use historical trends to see changes over time.
Using raw certification figures
Regional labour markets affect certification rates. Compare similar municipalities rather than absolute figures.
Examples: how the data has been used
Three questions — and how we answered them with data.
How do independent schools compare with municipal ones?
Compares merit values, teacher certification and pupil counts between independent and municipal schools. The differences are smaller than the debate suggests.
You may cite Skolkoll with a clear source reference. Rights and attribution for downloaded datasets vary by source and field; review the source and licence matrix before reuse.
Citation template
Skolkoll (2026). [Title of visualisation/dataset]. Skolkoll.se. Retrieved [date] from [URL].
BibTeX
@misc{skolkoll2026, author = {Skolkoll}, title = {[Title of visualisation/dataset]}, year = {2026}, url = {[URL]}, note = {Retrieved [date]} }
When is the data updated and how do you know if something has changed?
Source
Frequency
Content
Skolverket
Daily
School units, key metrics, SALSA
Kolada
Monthly
Municipal statistics, demographic measures
SCB
Monthly
Education level, income data
Schools Inspectorate
Quarterly
Inspection decisions, injunctions
Companies Registration Office
Weekly
Operators, corporate structure
How do you know if data has changed? Every CSV export includes a sync timestamp. The download page shows the latest update per dataset.
About the data
Update frequencyDaily sync from sources. Skolverket API, Kolada, SCB and the Schools Inspectorate.
Data sourcesSkolverket, Kolada (municipal statistics), SCB, Companies Registration Office and the Schools Inspectorate.
MethodStandardised definitions, SALSA model for benchmarking, documented limitations.
TraceabilityEvery measure has a source reference, version information and change log.
🅐Source-specific rights terms for datasets
Method
About this value
Cookie settings
We use cookies for visitor statistics, A/B testing and site improvement with Zoho PageSense, which may include heatmaps and session recording on public pages. Skolkoll does not sell visitor data and shows no advertising. Read more in our privacy policy