Sofiaängens skola in Stockholm
Part of group: Lilla Park och Min Skola AB
Headmaster: Susanne Krog-Jensen Allgulin
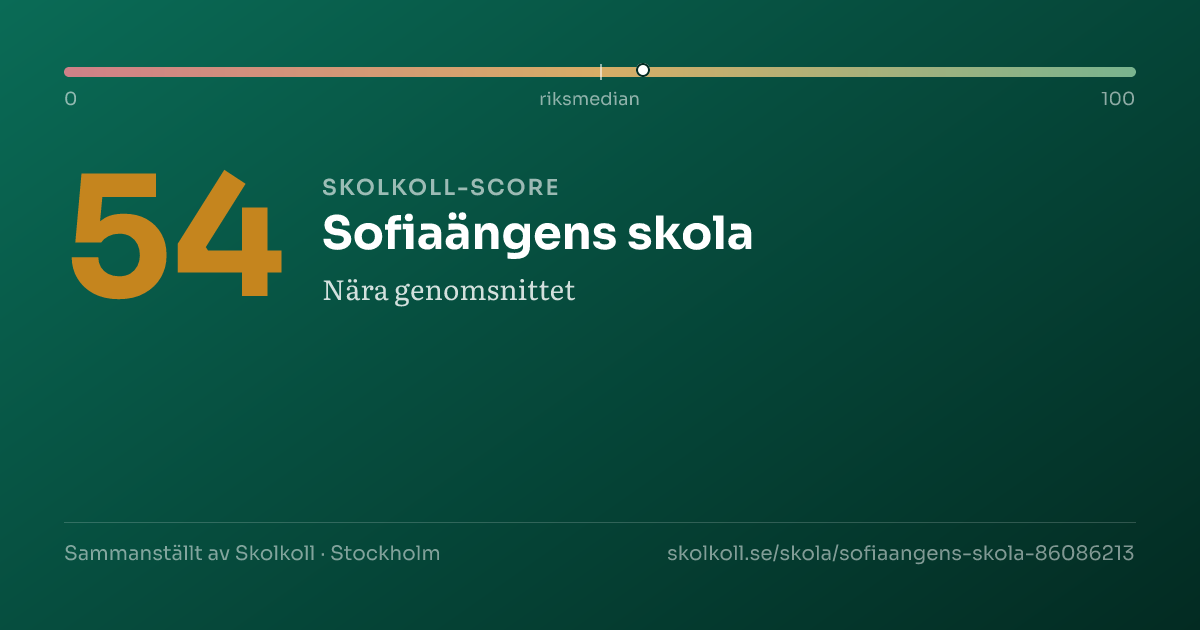
54
Skolkoll Score 54 out of 100. The scale goes from 0 (lowest) to 100 (highest). 50 is the average. Better than 50% of Sweden’s upper secondary schools.around the national midpointShows where a school sits within a comparison group. Percentile 80 means the school ranks above roughly 80 percent of that group.Compared to all upper-secondary schools nationally
A composite of five open data sources — a starting point, not a grade.
Data coverageMedium3/5
Why this score?
Skolkoll score is Skolkoll's composite indicator based on available data sources. It is not an official quality measure and should be read together with the underlying data.
3 of 5 score dimensions have school-specific data.
When school-specific data is missing for a dimension, the neutral value 50 is used. That does not automatically lower the school, but it makes the score less informative.

Sofiaängens skola is a small group-operated upper secondary school with 30 pupils.
Sofiaängens skola is a small group-operated upper secondary school with 30 pupils. The share of qualified teachers (81%) is above the national average of 78%.
- 30PupilsMunicipality: 43,610High reliability
- 81%Qualified teachersMunicipality: 81% · Sweden: 78%High reliability
- 182.7Year 9 merit valueMunicipality: 182.7 · Sweden: 182.7Moderate reliability
- 3.6Pupils per teacherMunicipality: 15.7 · Sweden: 12.1High reliability
- 160,660 SEKCost per pupil (municipal avg.)Sweden: 144,179 SEKLimited history
See how schools in Stockholm rank →
The most important facts in 3 points
- Upper secondary school in Stockholm with 30 pupils.
- The latest inspection (2016) shows an injunction or fine from the Schools Inspectorate.
- Applying? Go to the school's application link on this page.
Skolkoll interpretation
Sofiaängens skola is compared here with 96 other schools with the same school form in Stockholm municipality; it has 30 pupils versus the municipal average of 469.
The year-9 merit value is 182.7, in line with the municipal average and in line with the national average.
Qualified teachers: 81%, in line with the municipal average and 3 percentage points above the national average.
Pupils per teacher is 3.6, 12.1 lower than the municipal average.
Apply for a place? Use Stockholm e-service for school choice (opens in a new window).
Apply for a place? Use Stockholm e-service for upper-secondary application (opens in a new window).
4 values need extra caution
This applies only to the values listed here.
This value is missing in full or in part.
This affects
- Eligible for higher education
- Graduation rate
- Grade points (upper secondary)
- SALSA score
- This result metric can be affected by privacy suppression, small cohorts, and changes in pupil composition between years.
- SALSA is model-based and becomes less stable for small pupil groups or schools with rapidly changing pupil composition.
Other values here do not have this specific note.
School programmes
- Upper secondary school
Things to look into
No clear flag.
No clear attention flags from key-figure deviations or the School Inspectorate's public register. Detailed inspection history is shown in the "Safety & Inspection" card below.
School profile
The school's strengths compared with all upper-secondary schools nationally.
- Merit ratingP50
- Certified teachersP46
- Pupil-teacher ratioP99
- Eligibility (upper secondary)P50
Source: Skolverket, Swedish Schools Inspectorate.
Aerial view of the school
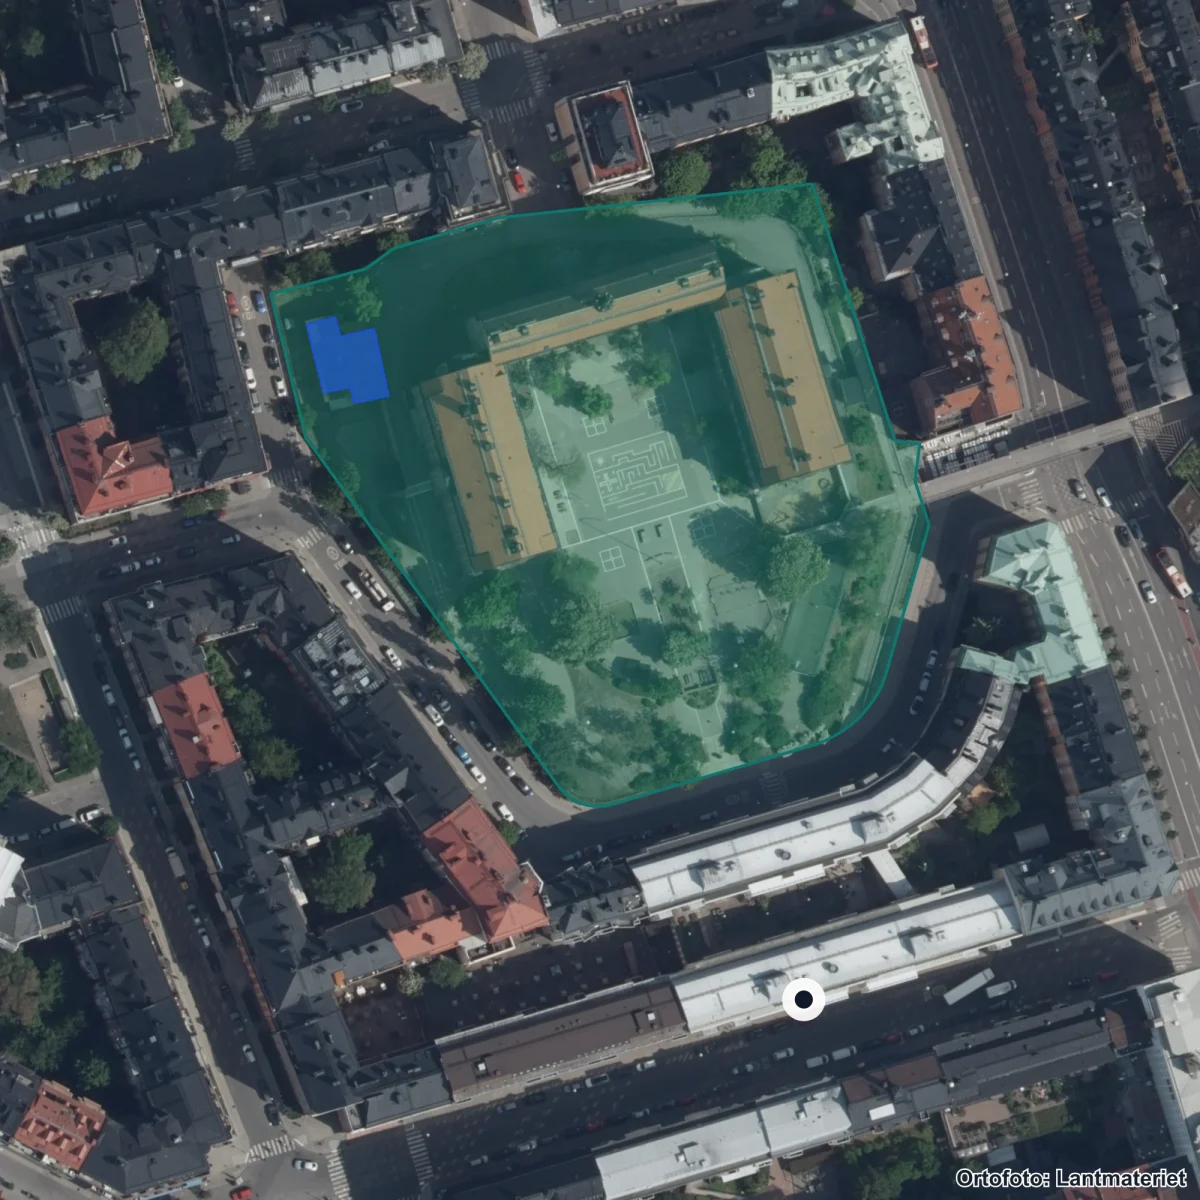
The school's property boundary and buildings from the Swedish Land Survey's property register. Updated 2026. Source: Lantmäteriet · CC BY 4.0
Entrances:1 Stockholm, Bergsunds Strand 43, Stockholm
School performance
Results
182.7Merit value yr 9Sweden: 182.7
Results
182.7
Merit value yr 9
Results are reported by the school operator to Skolverket.
Admission scores per programme
| Programme | Avg. | Sweden | Difference |
|---|---|---|---|
| Samhällsvetenskapsprogrammet | 142.5 | — |
Lowest admitted merit score from latest admission round. Smaller programmes (under 20 places) have larger year-to-year variation.
High reliability — Direct data from the school operator.
Staff
81%Qualified teachersMunicipality: 81% · Sweden: 78%
Staff
81%
Qualified teachers
81% of teachers hold a pedagogical degree — 3 percentage points above the national average.
- Qualified teachers Reliability: High reliability.
- 81%From 88% (2425) to 81% (2526)Municipality: 81% · Sweden: 78%
- Pupils per teacher Reliability: High reliability.
- 3.6From 4.2 (2425) to 3.6 (2526)Municipality: 15.7 · Sweden: 12.1
- Permanently employed Reliability: Moderate reliability.
- 97%
- Senior teachers (förstelärare) Reliability: Moderate reliability.
- —Data missing — the Swedish National Agency for Education has not published this value.
- Pupils per counsellor Reliability: Moderate reliability.
- 93.9
- Certified in their teaching subject Reliability: Moderate reliability.
- 88%
- Teachers (FTE) Reliability: Moderate reliability.
- 7.4
- Share of female teachers Reliability: Moderate reliability.
- 76%
- Teacher turnover Reliability: Moderate reliability.
- 4%
Moderate reliability — Mixed sources: certification + student/teacher ratio reported directly to Skolverket; other personnel fields from Skolverket's annual Personal report (1-2 year data lag).
School environment
Safety & Inspection
3 openRecently inspected 2016
Safety & Inspection
3 open
Recently inspected 2016
3 open remark(s) from the Schools Inspectorate.
- Latest inspection decision Reliability: High reliability.
- 2016-01-20 — Regelb. tillsyn Skolbeslut Stockholm Sofiaängens skola, 2015 (pdf, 4856 kB)
- Open remarks Reliability: High reliability.
- 3
High reliability — Inspection register and Skolenkäten survey.
Source: Schools Inspectorate + Skolverket · Last updated: 5 Jul 2026
Resources
160,660 SEKCost per pupil (total)Sweden: 144,179 SEK
Resources
160,660 SEK
Cost per pupil (total)
Cost per pupil is 11% above the national average.
Limited history — Cost data updated annually by Kolada/SCB.
Who runs the school
Operator
Lilla Park och Min Skola ABGroup operator1262 other schools in the municipality.
Operator
Lilla Park och Min Skola AB
Group operator

Lilla Park och Min Skola AB operates this school as part of a larger concern.
- Operator Reliability: High reliability.
- Lilla Park och Min Skola AB
- Operating form Reliability: High reliability.
- Group-operated
- Concern (parent organisation) Reliability: High reliability.
- Lilla Park och Min Skola AB
- Concern org. number Reliability: High reliability.
- 5564559523
- Other schools in municipality Reliability: High reliability.
- 1262
High reliability — Current data from Skolverket and Bolagsverket.
Source: Skolverket · Last updated: 5 Jul 2026
Next step: Apply for a place
Apply through Stockholm e-service for school choice.
Next step: Apply for a place
Apply through Stockholm e-service for upper-secondary application.
Contact and address
- Headmaster
- Susanne Krog-Jensen Allgulin
- Visiting address
- Bergsunds strand 43 A, 11738 Stockholm
- Postal address
- c/o C/o Cedergrenska AB, Box 16391, 10327 STOCKHOLM
- Phone
- 073-5227422
- info@sofiaangen.se
- Website
- www.sofiaangen.se/
- School unit code
86086213
Source: Skolverket School Unit Register · Pipeline-fetched on 2026-07-05.
Everyday travelAreas that reach the school within 15 minutes.
Reachability from the school
15 min on foot
15 min by bike
School
Support and inclusion
Support and student health
This panel shows sourced support-resource data where available and marks the rest as missing or uncertain. These fields do not affect score or ranking.
Missing or uncertain support-resource fields
- MissingStudent health teamIs there sourced information about student health functions at the school?
- MissingSpecial educatorIs special-education competence reported separately?
- MissingSpecial needs teacherAre special needs teachers reported separately?
- MissingSpecial education competenceIs there a verifiable aggregate metric for special education teachers?
- MissingSchool nurseIs there sourced information about school nurse resources?
- MissingPsychologistIs there sourced information about psychologist resources?
- MissingStudy and career guidanceIs there sourced information about study and career guidance?
- MissingLanguage supportIs there sourced information about language or mother-tongue support?
- MissingAdaptations and special supportIs there verified process information for adaptations and special support?
- MissingAccessibilityIs there sourced information about physical or pedagogical accessibility?
- MissingContact routeIs there a verified contact route for support questions?
Privacy rule: no individual pupil health, diagnosis, support decision or personal case data may be stored.
Daily-life profile
Everyday life at the school
Everyday facts are shown with a source where available. Fields not yet collected are listed together and do not affect score or ranking.
Not collected yet: School day times, After-school care, Language choices, Food and dining, Facilities and outdoor environment, Homework and study support. Suggest an addition →
Nearest and similar schools
- Kungl. Svenska Balettskolan gy1 km away· 40 pupils
- Sjömansskolan1 km away· 60 pupils
- Realgymnasiet i Sundbyberg8 km away· 50 pupils

About Stockholm municipality
School-form averages across the municipality, with links to deep-dive sub-pages.
- Schools
- 1,263
- Avg. merit (yr 9)
- 245.3+17.6
- Certified teachers
- 78%+5 pp
- Pupils per teacher
- 13.6+1.6
Source: Skolverket (aggregated school statistics).
Similar schools
The 5 most-similar upper secondary schools based on student count, geography, teacher certification and pupil composition.
Grade distribution
Share of pupils per grade, school year 2024/25.
−4.4Grade points per subject below national-test average — possibly stricter grading.
Source: SIRIS/Skolverket · See full A–F distribution in the data view →
School survey perspectives
Pupils, guardians and staff — same school, different answers
Survey results broken down by respondent group on a 0–10 scale. Groups can experience the same school very differently — notable gaps are highlighted below.
PupilsGuardians
Text summary of the chart:
- Pupils: Safety too few responses, Study environment too few responses, Stimulation too few responses, Support too few responses, Anti-bullying too few responses.
- Guardians: Safety too few responses, Study environment too few responses, Stimulation too few responses, Support too few responses.
Results with fewer than 5 responses are shown as “too few responses”.
Automatically flagged gaps
At least one respondent group has too few responses on the overlapping measures, so gaps cannot be calculated.
Staff results are not published per school by Skolinspektionen today, so the staff view appears only when available.
Pupils per year
Number of pupils per year group (total 32 pupils). Latest available year from Skolverket (SIRIS).
★ Watch Sofiaängens skola
Get email when new statistics are published, merit value changes significantly or the School Inspectorate makes a new decision.
Want to dig deeper?
The Data view shows complete history, sources, methodology and CSV export.
In-depth metrics
Staff stability
Improving
Source: Kolada (municipality-aggregated certified teacher trend).
School meals
Weekly menus and meal provider for this school's municipality.
No menu provider registered for this municipality yet.
Source: municipality's own meal portal — Skolkoll does not host menu content.
Inspections & decisions
Source: Skolinspektionen tillsynsregister (open data). Updated when new decisions are published. · See all decisions and review types in the data view → · Check current status at the Schools Inspectorate ↗
Admissions pressure & cutoffs
Applicants per place and latest admission cutoff per programme (2026).
High demand reflects popularity, which depends on location and reputation as well as quality. Cutoffs measure entry difficulty, not school quality.
- Introduktionsprogram IM Anpassad
- Samhällsvetenskapsprogrammet142.5points
Source: Gymnasieantagningen (regional admission databases). Latest year: 2026.
Explore further
More context about Sofiaängens skola, its municipality, operator and similar schools.
Compulsory schools in StockholmSee all compulsory schools in the municipality with results and comparisons.Upper secondary schools in StockholmSee all upper secondary schools in the municipality with graduation rates.Schools in StockholmOpen the municipality page with all schools, rankings, and local aggregates.Sofiaängen ABSee all schools, municipalities, and core metrics for the same provider.Lilla Park och Min Skola ABOpen the full school-group page with providers, municipalities, and group totals.Stockholms länCompare municipalities and school patterns across the whole county.Merit value year 9Compare year-9 merit values across municipalities and school environments.Certification vs Merit valueSee how merit values and upper-secondary eligibility move together.
Data coverage
What we do not know about Sofiaängens skola
Open school data is not complete. Use this as a checklist for what to verify with the school, provider or municipality.
- MediumResults and score inputsMedium data coverage: 3 of 5 score dimensions have school-specific data. When school-specific data is missing for a dimension, the neutral value 50 is used. That does not automatically lower the school, but it makes the score less informative.
- MediumEligibility and goal attainmentGrades, eligibility and goal-attainment data may be missing, suppressed or available only for some grades and school types.
- UncertainResources, teachers and staffTeacher and resource metrics do not always show subject mix, vacancies, student-health workflows or everyday staffing.
- PartialSupport resources and student healthSome support-resource fields have sourced statistics, but several parts are still missing or reported only in aggregate.
- MissingSafety and study environmentWe lack current or displayable survey data about safety and study environment for this school.
- PartialAdmissions, placement and important datesAdmission data is available for upper-secondary programmes where sources publish it, but it is historical and not a forecast.
- MissingVisits, facilities and everyday environmentWe lack sourced open-house information for this school. Facilities, accessibility and everyday environment are often not open comparable data.
For the school: get your Skolkoll badge
Work at this school? Embed an image showing the school's Skolkoll score that links to the full profile. The image is served from Skolkoll's image host and updates when we publish a new badge for the school.
See Data view for full sources and fetch dates per source.