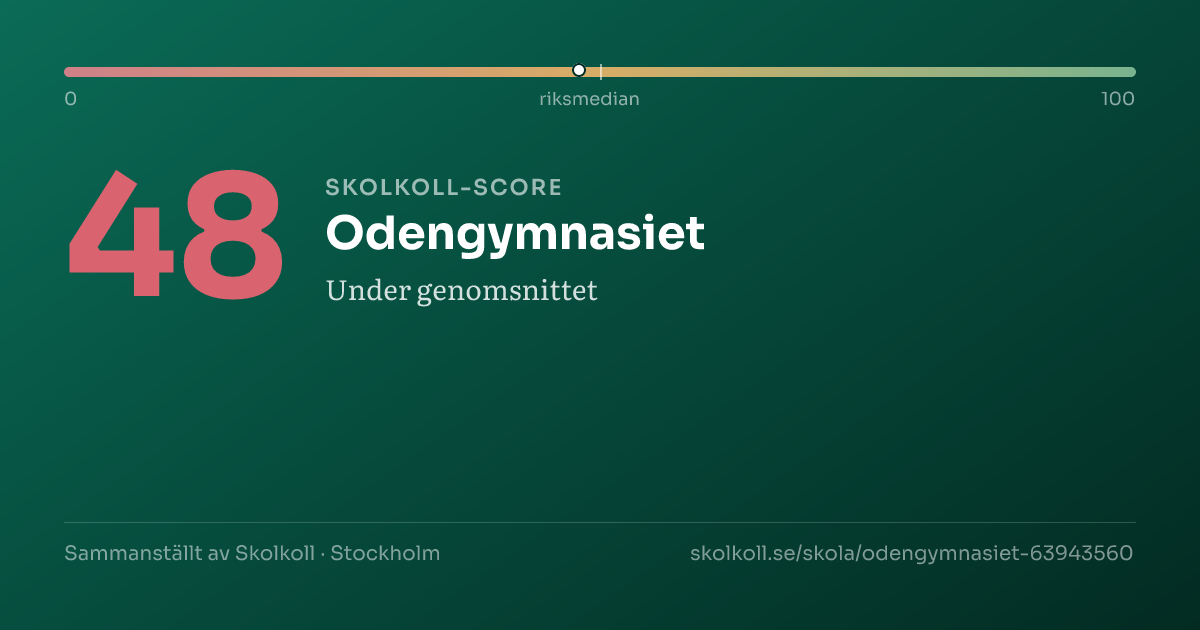
48
Skolkoll Score 48 out of 100. The scale goes from 0 (lowest) to 100 (highest). 50 is the average. Better than 50% of Sweden’s upper secondary schools.around the national midpointShows where a school sits within a comparison group. Percentile 80 means the school ranks above roughly 80 percent of that group.Compared to all upper-secondary schools nationally
A composite of five open data sources — a starting point, not a grade.
Data coverageMedium3/5
Why this score?
Skolkoll score is Skolkoll's composite indicator based on available data sources. It is not an official quality measure and should be read together with the underlying data.
3 of 5 score dimensions have school-specific data.
When school-specific data is missing for a dimension, the neutral value 50 is used. That does not automatically lower the school, but it makes the score less informative.

Odengymnasiet is a medium-sized group-operated upper secondary school with 260 pupils.
Odengymnasiet is a medium-sized group-operated upper secondary school with 260 pupils. The share of qualified teachers (79%) is above the national average of 78%.
- 260PupilsMunicipality: 43,610High reliability
- 79%Qualified teachersMunicipality: 81% · Sweden: 78%High reliability
- 15.8Pupils per teacherMunicipality: 15.7 · Sweden: 12.1High reliability
- 160,660 SEKCost per pupil (municipal avg.)Sweden: 144,179 SEKLimited history
See how schools in Stockholm rank →
The most important facts in 3 points
- Upper secondary school in Stockholm with 260 pupils.
- The latest inspection (2019) shows an injunction or fine from the Schools Inspectorate.
- Applying? Go to the school's application link on this page.
Skolkoll interpretation
Odengymnasiet is compared here with 96 other schools with the same school form in Stockholm municipality; it has 260 pupils versus the municipal average of 469.
Qualified teachers: 79%, 2 percentage points below the municipal average and 1 percentage point above the national average.
Pupils per teacher is 15.8, 0.1 higher than the municipal average.
Apply for a place? Use Stockholm e-service for upper-secondary application (opens in a new window).
3 values need extra caution
This applies only to the values listed here.
This value is missing in full or in part.
This affects
- Eligible for higher education
- Graduation rate
- Grade points (upper secondary)
- This result metric can be affected by privacy suppression, small cohorts, and changes in pupil composition between years.
Other values here do not have this specific note.
School programmes
- Upper secondary school
Things to look into
Worth looking into. These indicators are an attention aid, not a quality grade or risk score.
- 15.8 pupils per teacher — more than 3 above the national average (12.1).
School profile
The school's strengths compared with all upper-secondary schools nationally.
- Certified teachersP41
- Pupil-teacher ratioP19
Source: Skolverket, Swedish Schools Inspectorate.
Aerial view of the school
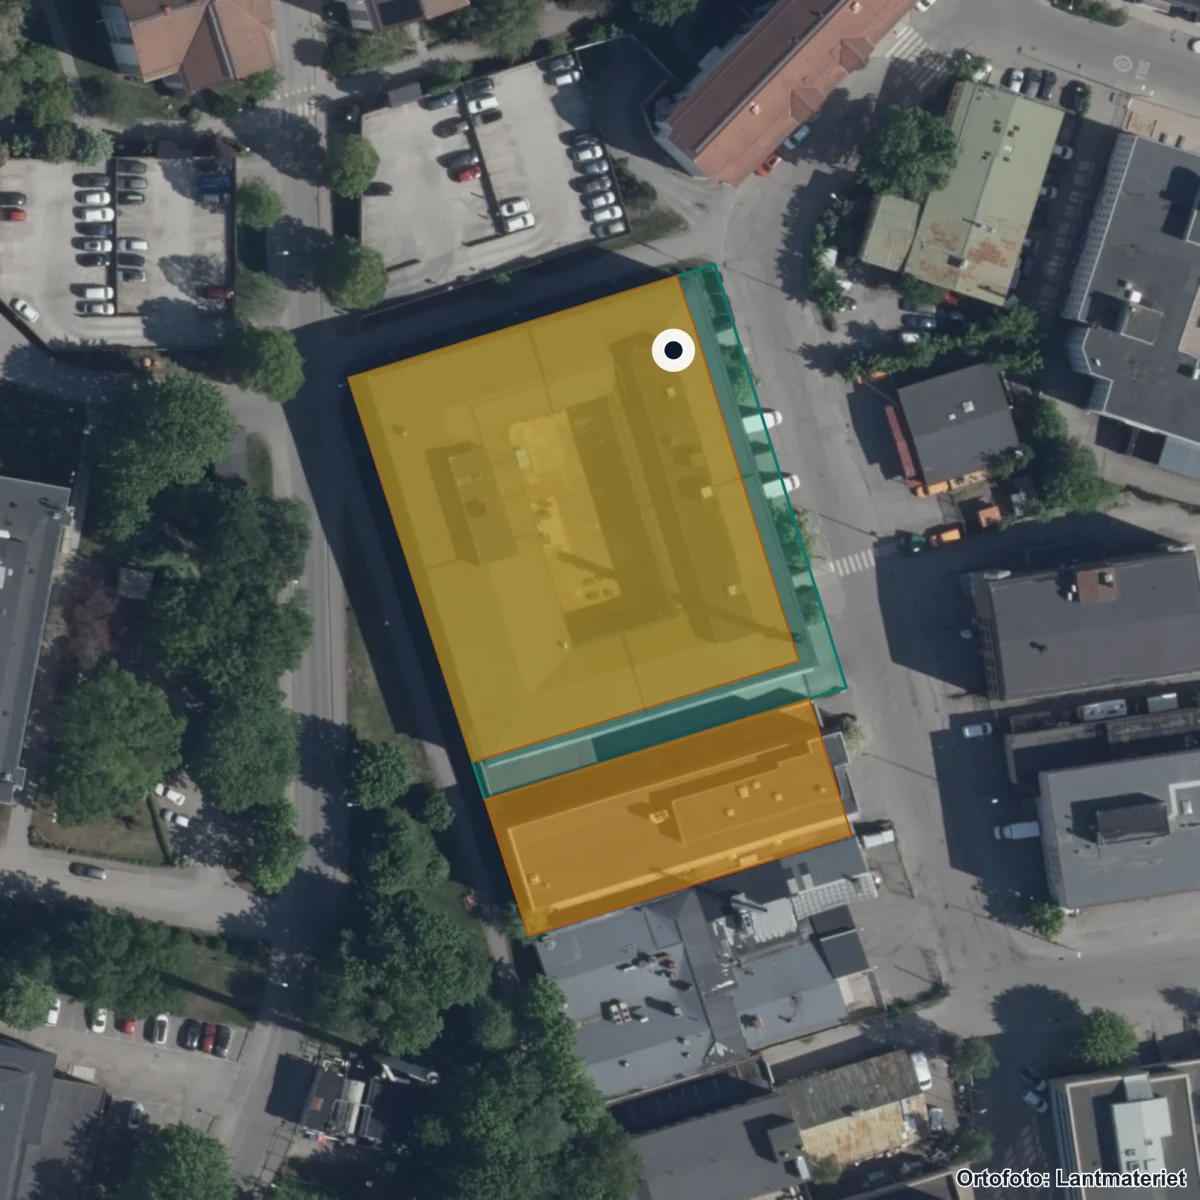
Aerial view of the school's surroundings. The property is marked from the register; building use has not been verified. Updated 2026. Source: Lantmäteriet · CC BY 4.0
Entrances:1 Stockholm, Instrumentvägen 31, Hägersten
School performance
Results
29.4%Studying in higher education
Results
29.4%
Studying in higher education
Shows what former students do 3 years after graduation, per Skolverket Statistikdatabasen.
Admission scores per programme
| Programme | Avg. | Sweden | Difference |
|---|---|---|---|
| Frisör- och stylistprogrammet | 90 | — | |
| Samhällsvetenskapsprogrammet | 150 | — | |
| Teknikprogrammet | 137.5 | — |
Lowest admitted merit score from latest admission round. Smaller programmes (under 20 places) have larger year-to-year variation.
After graduation (3 years)
| Outcome | Share |
|---|---|
| Studying in higher education | 29.4% |
| Established in the labor market (vocational programmes) | 53.9% |
| Established in the labor market (introduction programmes) | 48.6% |
Source: Skolverket Statistikdatabasen (per school unit, 3 years after graduation). Rows are independent outcome metrics and do not sum to 100%. One-year follow-up and a university-vs-other-studies split are not published in open data per school.
Moderate reliability — Source: Skolverket Statistikdatabasen (post-graduation outcomes, 3 years after graduation).
Staff
79%Qualified teachersMunicipality: 81% · Sweden: 78%
Staff
79%
Qualified teachers
79% of teachers hold a pedagogical degree — slightly above the national average.
High reliability — Reported directly by the school operator.
School environment
Safety & Inspection
3 openRecently inspected 2019Safety index: 71 / 100
Safety & Inspection
3 open
Recently inspected 2019
3 open remark(s) from the Schools Inspectorate.
- Latest inspection decision Reliability: High reliability.
- 2019-02-05 — Regelb. tillsyn Uppföljning beslut Stockholm Odengymnasiet, 2019 (pdf, 27850 kB)
- Open remarks Reliability: High reliability.
- 3
- Safety index Reliability: High reliability.
- 71 / 100Safety: 84% · Study peace: 56% · Anti-bullying: 67%
Safety index
71/ 100(High data coverage)
- Safety84%(national 84)
- Study peace56%(national 64)
- Anti-bullying67%(national 63)
School Survey — all perspectives
| Dimension | Pupils (gy 2) | Guardian | Staff |
|---|---|---|---|
| Safety | 8.4 / 10 | — | — |
| Study environment | 5.6 / 10 | — | — |
| Anti-bullying | 6.7 / 10 | — | — |
| Stimulation | 6.3 / 10 | — | — |
| Support | 6.5 / 10 | — | — |
Scale 0–10 (rescaled from Skolverket's 0–100). Guardian and staff perspectives are often not in open data.
High reliability — Inspection register and Skolenkäten survey.
Source: Schools Inspectorate + Skolverket · Last updated: 5 Jul 2026
Resources
160,660 SEKCost per pupil (total)Sweden: 144,179 SEK
Resources
160,660 SEK
Cost per pupil (total)
Cost per pupil is 11% above the national average.
Limited history — Cost data updated annually by Kolada/SCB.
Who runs the school
Operator
Lilla Park och Min Skola ABGroup operator1262 other schools in the municipality.
Operator
Lilla Park och Min Skola AB
Group operator

Lilla Park och Min Skola AB operates this school as part of a larger concern.
- Operator Reliability: High reliability.
- Lilla Park och Min Skola AB
- Operating form Reliability: High reliability.
- Group-operated
- Concern (parent organisation) Reliability: High reliability.
- Lilla Park och Min Skola AB
- Concern org. number Reliability: High reliability.
- 5564559523
- Other schools in municipality Reliability: High reliability.
- 1262
High reliability — Current data from Skolverket and Bolagsverket.
Source: Skolverket · Last updated: 5 Jul 2026
Next step: Apply for a place
Apply through Stockholm e-service for upper-secondary application.
Contact and address
- Headmaster
- Erik Bengtsson
- Visiting address
- Instrumentvägen 31, 12653 Hägersten
- Postal address
- c/o C/o Cedergrenska AB, Box 16391, 10327 STOCKHOLM
- Phone
- 08-40028970
- Website
- www.odengymnasiet.se/
- School unit code
63943560
Source: Skolverket School Unit Register · Pipeline-fetched on 2026-07-05.
Everyday travelAreas that reach the school within 15 minutes.
Reachability from the school
15 min on foot
15 min by bike
School
Daily-life profile
Everyday life at the school
Everyday facts are shown with a source where available. Fields not yet collected are listed together and do not affect score or ranking.
Not collected yet: School day times, After-school care, Language choices, Food and dining, Facilities and outdoor environment, Homework and study support. Suggest an addition →
Nearest and similar schools
- Distra Gymnasium0 km away· 270 pupils
- Stockholms Estetiska Gymnasium2 km away· 260 pupils
- Campus Manilla Gymnasium9 km away· 250 pupils

About Stockholm municipality
School-form averages across the municipality, with links to deep-dive sub-pages.
- Schools
- 1,263
- Avg. merit (yr 9)
- 245.3+17.6
- Certified teachers
- 78%+5 pp
- Pupils per teacher
- 13.6+1.6
Source: Skolverket (aggregated school statistics).
Similar schools
The 5 most-similar upper secondary schools based on student count, geography, teacher certification and pupil composition.
Distra Gymnasium
Stockholm
Merit: 13.5Cert: 81%270 pupils
Stockholms Estetiska Gymnasium
Stockholm
Merit: 15.2Cert: 82%260 pupils
Campus Manilla Gymnasium
Stockholm
Merit: 18.9Cert: 79%250 pupils
REFIS Rör- och Elentr. friskola Sthlm
Stockholm
Merit: 13.7Cert: 81%270 pupils
Affärsgymnasiet Stockholm
Stockholm
Merit: 13.4Cert: 82%220 pupils
★ Watch Odengymnasiet
Get email when new statistics are published, merit value changes significantly or the School Inspectorate makes a new decision.
Want to dig deeper?
The Data view shows complete history, sources, methodology and CSV export.
In-depth metrics
Staff stability
Improving
Source: Kolada (municipality-aggregated certified teacher trend).
Safety and study environment (SkolenkätenThe Schools Inspectorate’s survey sent to pupils, parents, and staff about safety, classroom order, and teaching.Read more in glossary →)
The school survey shows pupil experience where responses are available. Read values together with year, response coverage and unknowns.
Coverage: 1 displayed year group · year 2026.
Strongest (Upper-sec. year 2)
- Safety: 84 (national 84)
- Anti-bullying: 67 (national 63)
Weakest (Upper-sec. year 2)
- Study environment: 56 (national 64)
- Stimulation: 63 (national 61)
Support-needs policy · School-choice guide
Source: Skolinspektionen Skolenkäten 2026. Updated annually. · See all years and dimensions in the data view →
School meals
Weekly menus and meal provider for this school's municipality.
No menu provider registered for this municipality yet.
Source: municipality's own meal portal — Skolkoll does not host menu content.
Inspections & decisions
Source: Skolinspektionen tillsynsregister (open data). Updated when new decisions are published. · See all decisions and review types in the data view → · Check current status at the Schools Inspectorate ↗
Admissions pressure & cutoffs
Applicants per place and latest admission cutoff per programme (2026).
High demand reflects popularity, which depends on location and reputation as well as quality. Cutoffs measure entry difficulty, not school quality.
- Frisör- och stylistprogrammet90points
- Hantverksprogrammet
- Introduktionsprogram IM Anpassad
- Introduktionsprogram IM
- Introduktionsprogram IM Yrkesintro
- Samhällsvetenskapsprogrammet150points
- Teknikprogrammet137.5points
Source: Gymnasieantagningen (regional admission databases). Latest year: 2026.
Explore further
More context about Odengymnasiet, its municipality, operator and similar schools.
Upper secondary schools in StockholmSee all upper secondary schools in the municipality with graduation rates.Schools in StockholmOpen the municipality page with all schools, rankings, and local aggregates.MOV Gymnasieskolor ABSee all schools, municipalities, and core metrics for the same provider.Lilla Park och Min Skola ABOpen the full school-group page with providers, municipalities, and group totals.Stockholms länCompare municipalities and school patterns across the whole county.Upper secondary schoolsGet the national upper-secondary overview of school size and outcomes.Cost vs ResultsCompare outcomes and resource levels across municipalities and school markets.Compare schoolsBuild a side-by-side comparison with the schools you care about.
Data coverage
What we do not know about Odengymnasiet
Open school data is not complete. Use this as a checklist for what to verify with the school, provider or municipality.
- MediumResults and score inputsMedium data coverage: 3 of 5 score dimensions have school-specific data. When school-specific data is missing for a dimension, the neutral value 50 is used. That does not automatically lower the school, but it makes the score less informative.
- MediumEligibility and goal attainmentGrades, eligibility and goal-attainment data may be missing, suppressed or available only for some grades and school types.
- UncertainResources, teachers and staffTeacher and resource metrics do not always show subject mix, vacancies, student-health workflows or everyday staffing.
- MissingSupport resources and student healthWe do not yet have a verified national data source for special education, student health, adaptations, language support or contact routes per school.
- PartialSafety and study environmentThe school survey is shown where available, but not every grade and perspective is always covered.
- PartialAdmissions, placement and important datesAdmission data is available for upper-secondary programmes where sources publish it, but it is historical and not a forecast.
- MissingVisits, facilities and everyday environmentWe lack sourced open-house information for this school. Facilities, accessibility and everyday environment are often not open comparable data.
For the school: get your Skolkoll badge
Work at this school? Embed an image showing the school's Skolkoll score that links to the full profile. The image is served from Skolkoll's image host and updates when we publish a new badge for the school.
See Data view for full sources and fetch dates per source.