43
Skolkoll Score 43 out of 100. The scale goes from 0 (lowest) to 100 (highest). 50 is the average. This school performs below average.Below averageCompared to all compulsory schools nationally
Limited confidence: the sample is small, so the score may vary more than usual.
A composite of five open data sources — a starting point, not a grade.
Data coverageMedium2/5
Why this score?
Skolkoll score is Skolkoll's composite indicator based on available data sources. It is not an official quality measure and should be read together with the underlying data.
2 of 5 score dimensions have school-specific data. The pupil sample is limited.
When school-specific data is missing for a dimension, the neutral value 50 is used. That does not automatically lower the school, but it makes the score less informative.

Magelungens grundskola Helsingborg is a small group-operated compulsory school with 20 pupils.
Magelungens grundskola Helsingborg is a small group-operated compulsory school with 20 pupils. The share of qualified teachers (44%) is below the national average of 72%.
- 20PupilsMunicipality: 16,510High reliability
- 44%Qualified teachersMunicipality: 73% · Sweden: 72%High reliability
- 3.9Pupils per teacherMunicipality: 12.2 · Sweden: 12.0High reliability
- 125,859 SEKCost per pupil (municipal avg.)Sweden: 144,179 SEKLimited history
See how schools in Helsingborg rank →
The most important facts in 3 points
- Compulsory school in Helsingborg with 20 pupils.
- The latest inspection (2015) shows an injunction or fine from the Schools Inspectorate.
- Applying? Go to the school's application link on this page.
Skolkoll interpretation
Magelungens grundskola Helsingborg is compared here with 59 other schools with the same school form in Helsingborg municipality; it has 20 pupils versus the municipal average of 280.
Qualified teachers: 44%, 29 percentage points below the municipal average and 28 percentage points below the national average.
Pupils per teacher is 3.9, 8.3 lower than the municipal average.
Apply for a place? Use Helsingborg e-service for school choice (opens in a new window).
3 values need extra caution
This applies only to the values listed here.
This value is missing in full or in part.
This affects
- Eligible for vocational programmes
- Merit score year 9
- SALSA score
- This result metric can be affected by privacy suppression, small cohorts, and changes in pupil composition between years.
- SALSA is model-based and becomes less stable for small pupil groups or schools with rapidly changing pupil composition.
Other values here do not have this specific note.
School programmes
- Compulsory school
Things to look into
Worth looking into. These indicators are an attention aid, not a quality grade or risk score.
- 44% qualified teachers — more than 10 percentage points below the national average (72%).
School profile
The school's strengths compared with all primary schools nationally.
- Certified teachersP4
- Pupil-teacher ratioP99
Source: Skolverket, Swedish Schools Inspectorate.
Aerial view of the school
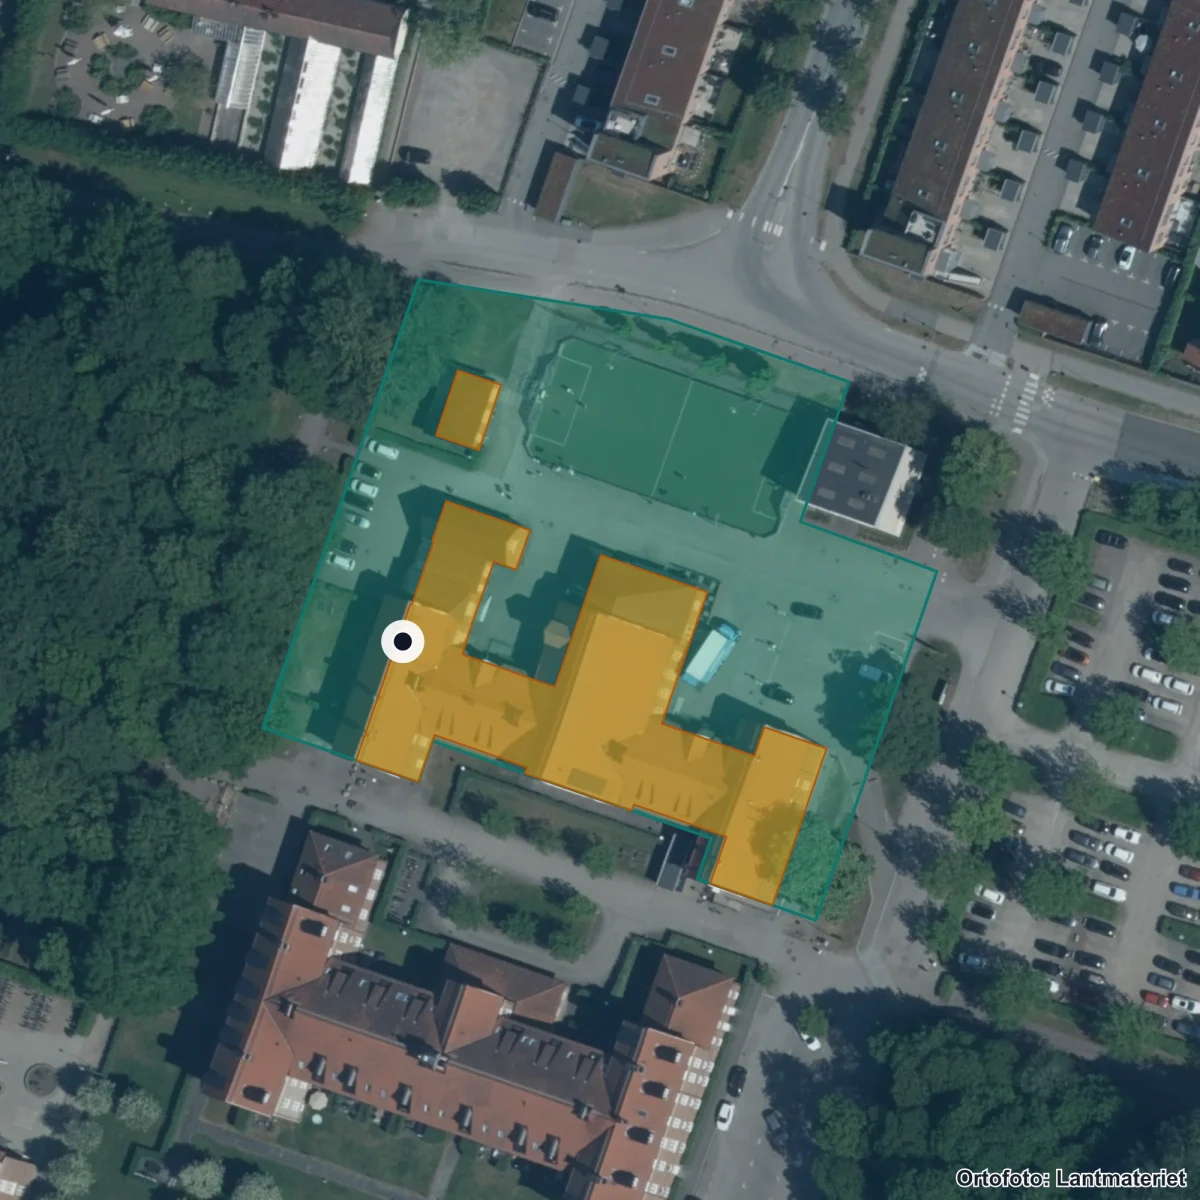
Aerial view of the school's surroundings. The property is marked from the register; building use has not been verified. Updated 2026. Source: Lantmäteriet · CC BY 4.0
Entrances:1 Helsingborg, Paviljonggången 3, Helsingborg
School performance
Staff
44%Qualified teachersMunicipality: 73% · Sweden: 72%
Staff
44%
Qualified teachers
School environment
Safety & Inspection
1 openRecently inspected 2015
Safety & Inspection
1 open
Recently inspected 2015
1 open remark(s) from the Schools Inspectorate.
- Latest inspection decision Reliability: High reliability.
- 2015-12-16 — Regelb. tillsyn Skolbeslut Helsingborg Magelungens grundskola Helsingborg, 2015 (pdf, 8905 kB)
- Open remarks Reliability: High reliability.
- 1
High reliability — Inspection register and Skolenkäten survey.
Source: Schools Inspectorate + Skolverket · Last updated: 5 Jul 2026
Resources
125,859 SEKCost per pupil (total)Sweden: 144,179 SEK
Resources
125,859 SEK
Cost per pupil (total)
Cost per pupil is 13% below the national average.
Limited history — Cost data updated annually by Kolada/SCB.
Who runs the school
Operator
Magelhusen ABGroup operator233 other schools in the municipality.
Operator
Magelhusen AB
Group operator

Magelhusen AB operates this school as part of a larger concern.
- Operator Reliability: High reliability.
- Magelhusen AB
- Operating form Reliability: High reliability.
- Group-operated
- Concern (parent organisation) Reliability: High reliability.
- Magelhusen AB
- Concern org. number Reliability: High reliability.
- 5567089130
- Other schools in municipality Reliability: High reliability.
- 233
High reliability — Current data from Skolverket and Bolagsverket.
Source: Skolverket · Last updated: 5 Jul 2026
Next step: Apply for a place
Apply through Helsingborg e-service for school choice.
Contact and address
- Headmaster
- Marlene Frostberg
- Visiting address
- Paviljonggången 3, 25451 Helsingborg
- Postal address
- Lumaparksvägen 7, 12031 STOCKHOLM
- Phone
- 070-7427311
- Website
- www.magelungen.com/
- School unit code
90553565
Source: Skolverket School Unit Register · Pipeline-fetched on 2026-07-05.
Everyday travelAreas that reach the school within 15 minutes.
Reachability from the school
15 min on foot
15 min by bike
School
Support and inclusion
Support and student health
This panel shows sourced support-resource data where available and marks the rest as missing or uncertain. These fields do not affect score or ranking.
Missing or uncertain support-resource fields
- MissingStudent health teamIs there sourced information about student health functions at the school?
- MissingSpecial educatorIs special-education competence reported separately?
- MissingSpecial needs teacherAre special needs teachers reported separately?
- MissingSpecial education competenceIs there a verifiable aggregate metric for special education teachers?
- MissingSchool nurseIs there sourced information about school nurse resources?
- MissingPsychologistIs there sourced information about psychologist resources?
- MissingStudy and career guidanceIs there sourced information about study and career guidance?
- MissingLanguage supportIs there sourced information about language or mother-tongue support?
- MissingAdaptations and special supportIs there verified process information for adaptations and special support?
- MissingAccessibilityIs there sourced information about physical or pedagogical accessibility?
- MissingContact routeIs there a verified contact route for support questions?
Privacy rule: no individual pupil health, diagnosis, support decision or personal case data may be stored.
Daily-life profile
Everyday life at the school
Everyday facts are shown with a source where available. Fields not yet collected are listed together and do not affect score or ranking.
Not collected yet: School day times, After-school care, Language choices, Food and dining, Facilities and outdoor environment, Homework and study support. Suggest an addition →
Nearest and similar schools
- Montemini Hbg, Montessoriskola0 km away· 40 pupils
- Waldorfskolan Kastanjen8 km away· 20 pupils
- Vikens Montessori11 km away· 20 pupils

About Helsingborg municipality
School-form averages across the municipality, with links to deep-dive sub-pages.
- Schools
- 234
- Avg. merit (yr 9)
- 224.9−2.8
- Certified teachers
- 73%in line
- Pupils per teacher
- 13.0+1.0
Source: Skolverket (aggregated school statistics).
Similar schools
The 5 most-similar compulsory schools based on student count, geography, teacher certification and pupil composition.
Pupils per year
Number of pupils per year group (total 17 pupils). Latest available year from Skolverket (SIRIS).
★ Watch Magelungens grundskola Helsingborg
Get email when new statistics are published, merit value changes significantly or the School Inspectorate makes a new decision.
Want to dig deeper?
The Data view shows complete history, sources, methodology and CSV export.
In-depth metrics
Staff stability
Improving
Source: Kolada (municipality-aggregated certified teacher trend).
School meals
Weekly menus and meal provider for this school's municipality.
No menu provider registered for this municipality yet.
Source: municipality's own meal portal — Skolkoll does not host menu content.
Inspections & decisions
Source: Skolinspektionen tillsynsregister (open data). Updated when new decisions are published. · See all decisions and review types in the data view → · Check current status at the Schools Inspectorate ↗
Explore further
More context about Magelungens grundskola Helsingborg, its municipality, operator and similar schools.
Compulsory schools in HelsingborgSee all compulsory schools in the municipality with results and comparisons.Schools in HelsingborgOpen the municipality page with all schools, rankings, and local aggregates.Magelungen Utveckling ABSee all schools, municipalities, and core metrics for the same provider.Magelhusen ABOpen the full school-group page with providers, municipalities, and group totals.Skåne länCompare municipalities and school patterns across the whole county.Merit value year 9Compare year-9 merit values across municipalities and school environments.Certification vs Merit valueSee how merit values and upper-secondary eligibility move together.Compare schoolsBuild a side-by-side comparison with the schools you care about.
Data coverage
What we do not know about Magelungens grundskola Helsingborg
Open school data is not complete. Use this as a checklist for what to verify with the school, provider or municipality.
- MediumResults and score inputsMedium data coverage: 2 of 5 score dimensions have school-specific data. The pupil sample is limited. When school-specific data is missing for a dimension, the neutral value 50 is used. That does not automatically lower the school, but it makes the score less informative.
- MediumEligibility and goal attainmentGrades, eligibility and goal-attainment data may be missing, suppressed or available only for some grades and school types.
- UncertainResources, teachers and staffTeacher and resource metrics do not always show subject mix, vacancies, student-health workflows or everyday staffing.
- PartialSupport resources and student healthSome support-resource fields have sourced statistics, but several parts are still missing or reported only in aggregate.
- MissingSafety and study environmentWe lack current or displayable survey data about safety and study environment for this school.
- UncertainAdmissions, placement and important datesMunicipal placement rules, queues and important dates require a local source and should be checked with the municipality or school.
- MissingVisits, facilities and everyday environmentWe lack sourced open-house information for this school. Facilities, accessibility and everyday environment are often not open comparable data.
See Data view for full sources and fetch dates per source.