around the national midpointShows where a school sits within a comparison group. Percentile 80 means the school ranks above roughly 80 percent of that group.Compared to all compulsory schools nationally
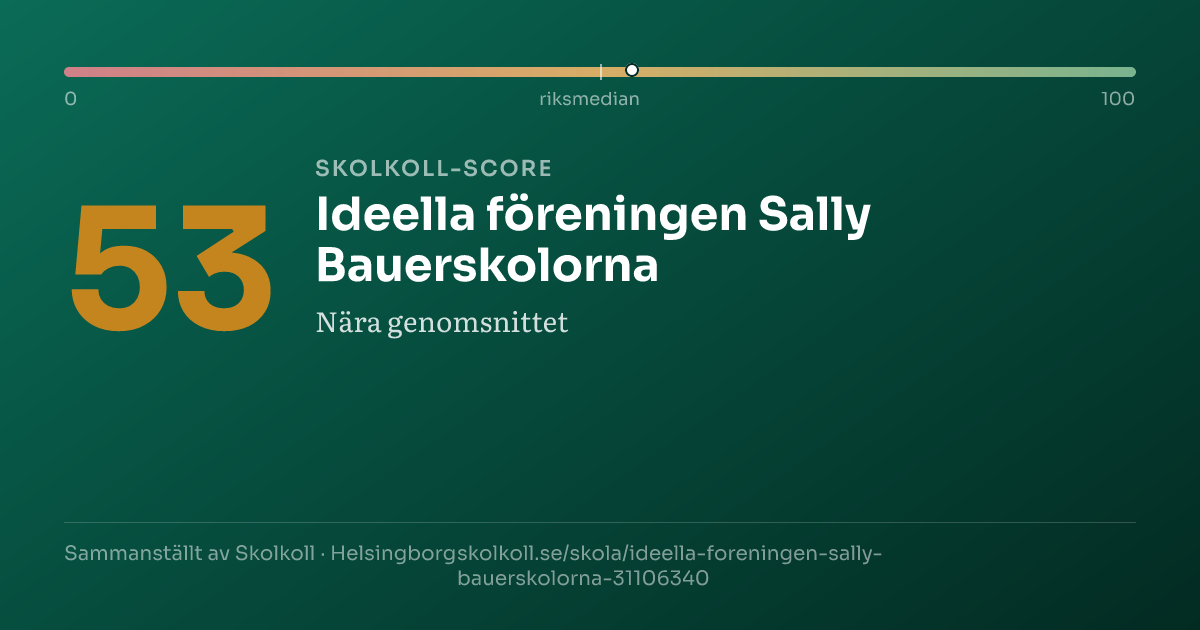
0median100
Skolkoll Score 53 out of 100. The scale goes from 0 (lowest) to 100 (highest). 50 is the average. Better than 50% of Sweden’s compulsory schools.
A composite of five open data sources — a starting point, not a grade.
Data coverageMedium2/5
Why this score?
Skolkoll score is Skolkoll's composite indicator based on available data sources. It is not an official quality measure and should be read together with the underlying data.
2 of 5 score dimensions have school-specific data.
When school-specific data is missing for a dimension, the neutral value 50 is used. That does not automatically lower the school, but it makes the score less informative.
Ideella föreningen Sally Bauerskolorna is a medium-sized independent compulsory school with 120 pupils.
Ideella föreningen Sally Bauerskolorna is a medium-sized independent compulsory school with 120 pupils. The share of qualified teachers (81%) is above the national average of 72%.
Ideella föreningen Sally Bauerskolorna is compared here with 59 other schools with the same school form in Helsingborg municipality; it has 120 pupils versus the municipal average of 280.
Qualified teachers: 81%, 8 percentage points above the municipal average and 9 percentage points above the national average.
Pupils per teacher is 13.8, 1.6 higher than the municipal average.
Independent school data for all of Sweden
SCHOOL REPORT
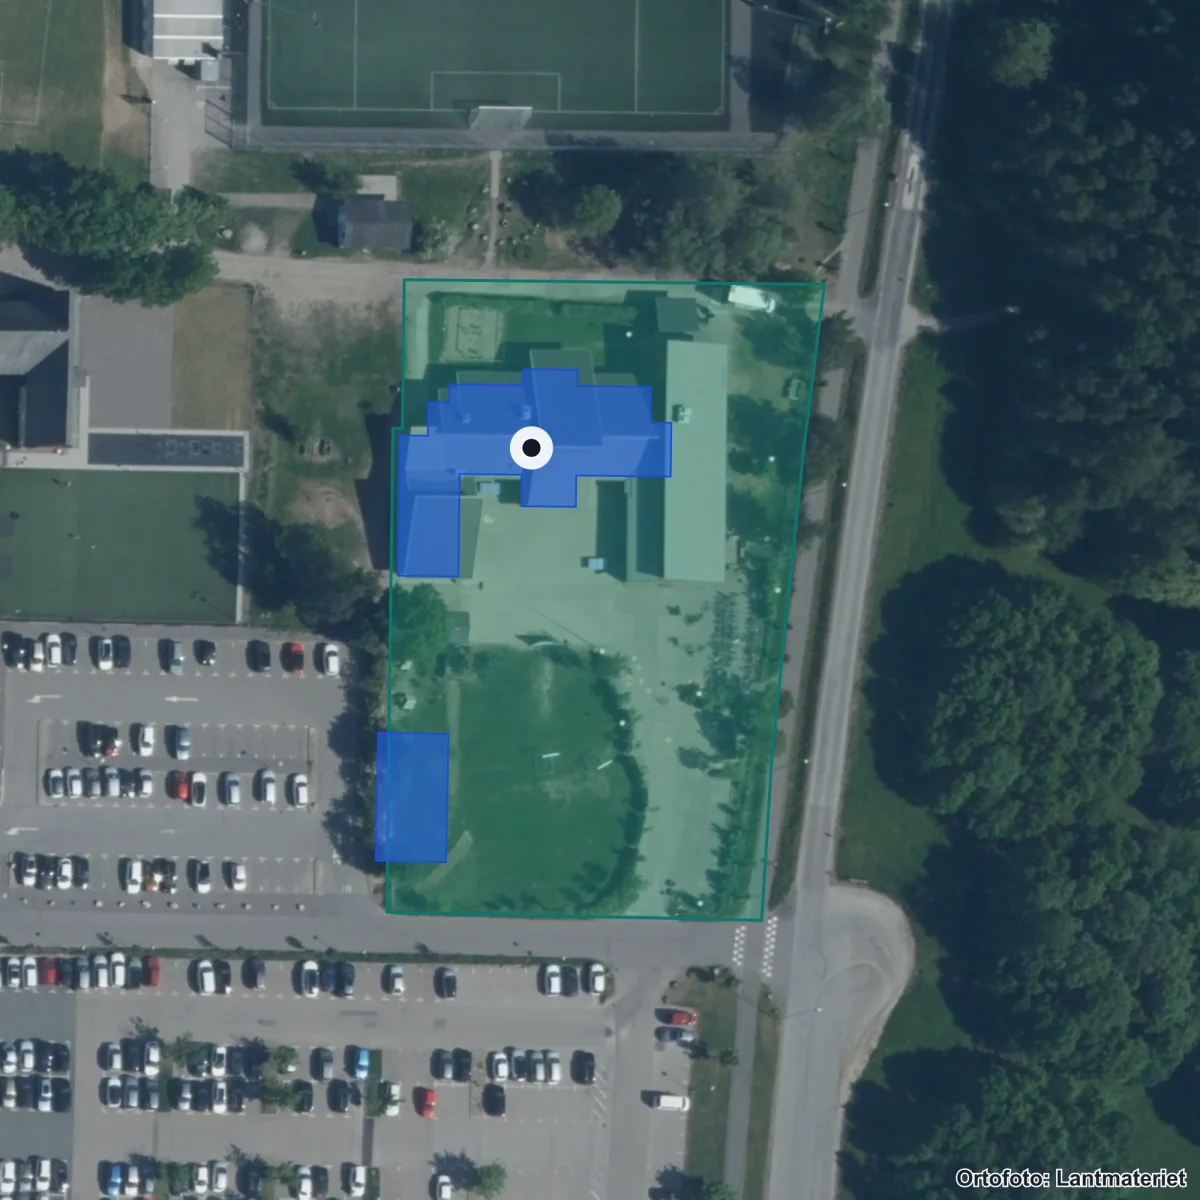
Ideella föreningen Sally Bauerskolorna
Compulsory school · Year 1–6 · Helsingborg, Skåne County
Provider: Ideella Föreningen Sally Bauerskolorna · School unit code: 31106340
Statistics: school year 2024/25 · Updated 2026-07-05
No clear attention flags from key-figure deviations or the School Inspectorate's public register. Detailed inspection history is shown in the "Safety & Inspection" card below.
School profile
The school's strengths compared with all primary schools nationally.
Pupils, guardians and staff — same school, different answers
Survey results broken down by respondent group on a 0–10 scale. Groups can experience the same school very differently — notable gaps are highlighted below.
PupilsGuardians
Text summary of the chart:
Pupils: Safety too few responses, Study environment too few responses, Stimulation too few responses, Support too few responses, Anti-bullying too few responses.
Guardians: Safety too few responses, Study environment too few responses, Stimulation too few responses, Support too few responses.
Results with fewer than 5 responses are shown as “too few responses”.
Automatically flagged gaps
At least one respondent group has too few responses on the overlapping measures, so gaps cannot be calculated.
Staff results are not published per school by Skolinspektionen today, so the staff view appears only when available.
Pupils per year
Number of pupils per year group (total 120 pupils). Latest available year from Skolverket (SIRIS).
Yr 1
20 pupils in Yr 1
Yr 2
20 pupils in Yr 2
Yr 3
20 pupils in Yr 3
Yr 4
20 pupils in Yr 4
Yr 5
20 pupils in Yr 5
Yr 6
20 pupils in Yr 6
★ Watch Ideella föreningen Sally Bauerskolorna
Get email when new statistics are published, merit value changes significantly or the School Inspectorate makes a new decision.
Want to dig deeper?
The Data view shows complete history, sources, methodology and CSV export.
What we do not know about Ideella föreningen Sally Bauerskolorna
Open school data is not complete. Use this as a checklist for what to verify with the school, provider or municipality.
MediumResults and score inputsMedium data coverage: 2 of 5 score dimensions have school-specific data. When school-specific data is missing for a dimension, the neutral value 50 is used. That does not automatically lower the school, but it makes the score less informative.
MediumEligibility and goal attainmentGrades, eligibility and goal-attainment data may be missing, suppressed or available only for some grades and school types.
UncertainResources, teachers and staffTeacher and resource metrics do not always show subject mix, vacancies, student-health workflows or everyday staffing.
MissingSupport resources and student healthWe do not yet have a verified national data source for special education, student health, adaptations, language support or contact routes per school.
MissingSafety and study environmentWe lack current or displayable survey data about safety and study environment for this school.
UncertainAdmissions, placement and important datesMunicipal placement rules, queues and important dates require a local source and should be checked with the municipality or school.
MissingVisits, facilities and everyday environmentWe lack sourced open-house information for this school. Facilities, accessibility and everyday environment are often not open comparable data.
Places, admission and support are decided by the school, provider or municipality. Use this as a checklist, not a promise of outcome.
For the school: get your Skolkoll badge
Work at this school? Embed an image showing the school's Skolkoll score that links to the full profile. The image is served from Skolkoll's image host and updates when we publish a new badge for the school.
Data sources: Skolverket, Kolada (RKA/SKR), SCB · Updated 2026-07-05
Method
About this value
Cookie settings
We use cookies for visitor statistics, A/B testing and site improvement (Google Analytics 4 with IP anonymization and Zoho PageSense, which may include heatmaps and session recording on public pages). Skolkoll does not sell visitor data and shows no advertising. Read more in our privacy policy