I Ur och Skur Utsikten in Lidingö
Headmaster: Charlotta Bürger Hyllienmark
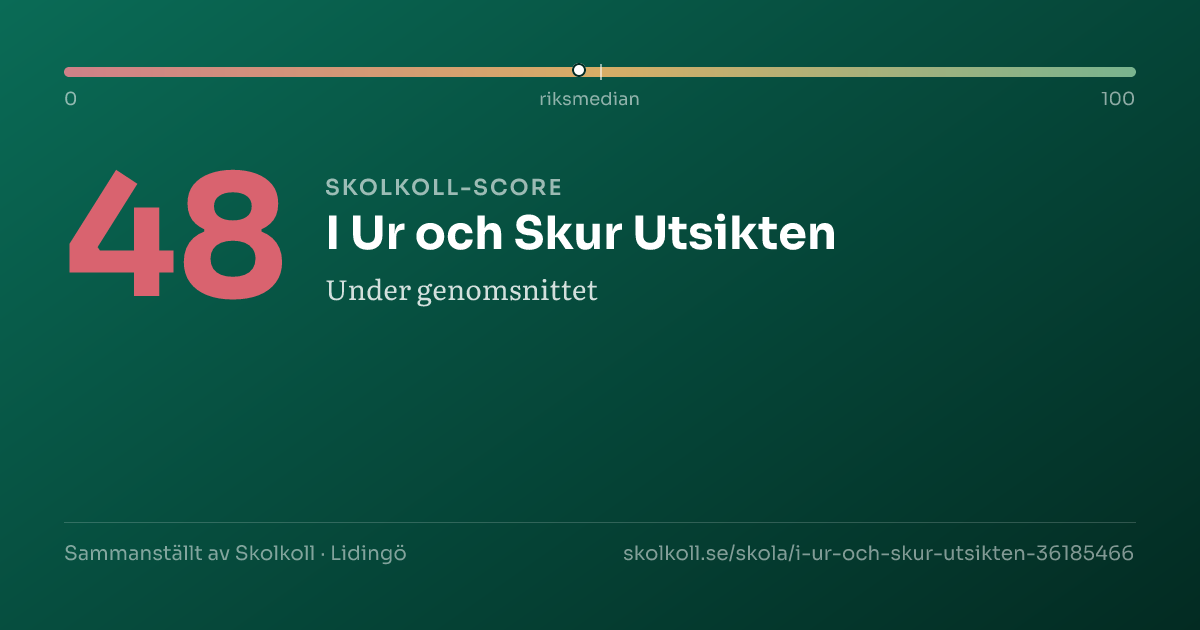
48
Skolkoll Score 48 out of 100. The scale goes from 0 (lowest) to 100 (highest). 50 is the average. Better than 50% of Sweden’s compulsory schools.around the national midpointShows where a school sits within a comparison group. Percentile 80 means the school ranks above roughly 80 percent of that group.Compared to all compulsory schools nationally
A composite of five open data sources — a starting point, not a grade.
Data coverageMedium3/5
Why this score?
Skolkoll score is Skolkoll's composite indicator based on available data sources. It is not an official quality measure and should be read together with the underlying data.
3 of 5 score dimensions have school-specific data.
When school-specific data is missing for a dimension, the neutral value 50 is used. That does not automatically lower the school, but it makes the score less informative.
I Ur och Skur Utsikten is a small independent compulsory school with 80 pupils.
I Ur och Skur Utsikten is a small independent compulsory school with 80 pupils. The share of qualified teachers (46%) is below the national average of 72%.
- 80PupilsMunicipality: 5,280High reliability
- 46%Qualified teachersMunicipality: 75% · Sweden: 72%High reliability
- 10.3Pupils per teacherMunicipality: 13.5 · Sweden: 12.0High reliability
- 129,633 SEKCost per pupil (municipal avg.)Sweden: 144,179 SEKLimited history
See how schools in Lidingö rank →
The most important facts in 3 points
- Compulsory school in Lidingö with 80 pupils.
- The latest inspection (2012) shows an injunction or fine from the Schools Inspectorate.
- Applying? Go to the school's application link on this page.
Skolkoll interpretation
I Ur och Skur Utsikten is compared here with 17 other schools with the same school form in Lidingö municipality; it has 80 pupils versus the municipal average of 311.
Qualified teachers: 46%, 29 percentage points below the municipal average and 26 percentage points below the national average.
Pupils per teacher is 10.3, 3.2 lower than the municipal average.
Apply for a place? Use Lidingö e-service for school choice (opens in a new window).
School programmes
- Utepedagogik
Things to look into
Worth looking into. These indicators are an attention aid, not a quality grade or risk score.
- 46% qualified teachers — more than 10 percentage points below the national average (72%).
School profile
The school's strengths compared with all primary schools nationally.
- Certified teachersP5
- Pupil-teacher ratioP76
Source: Skolverket, Swedish Schools Inspectorate.
Aerial view of the school
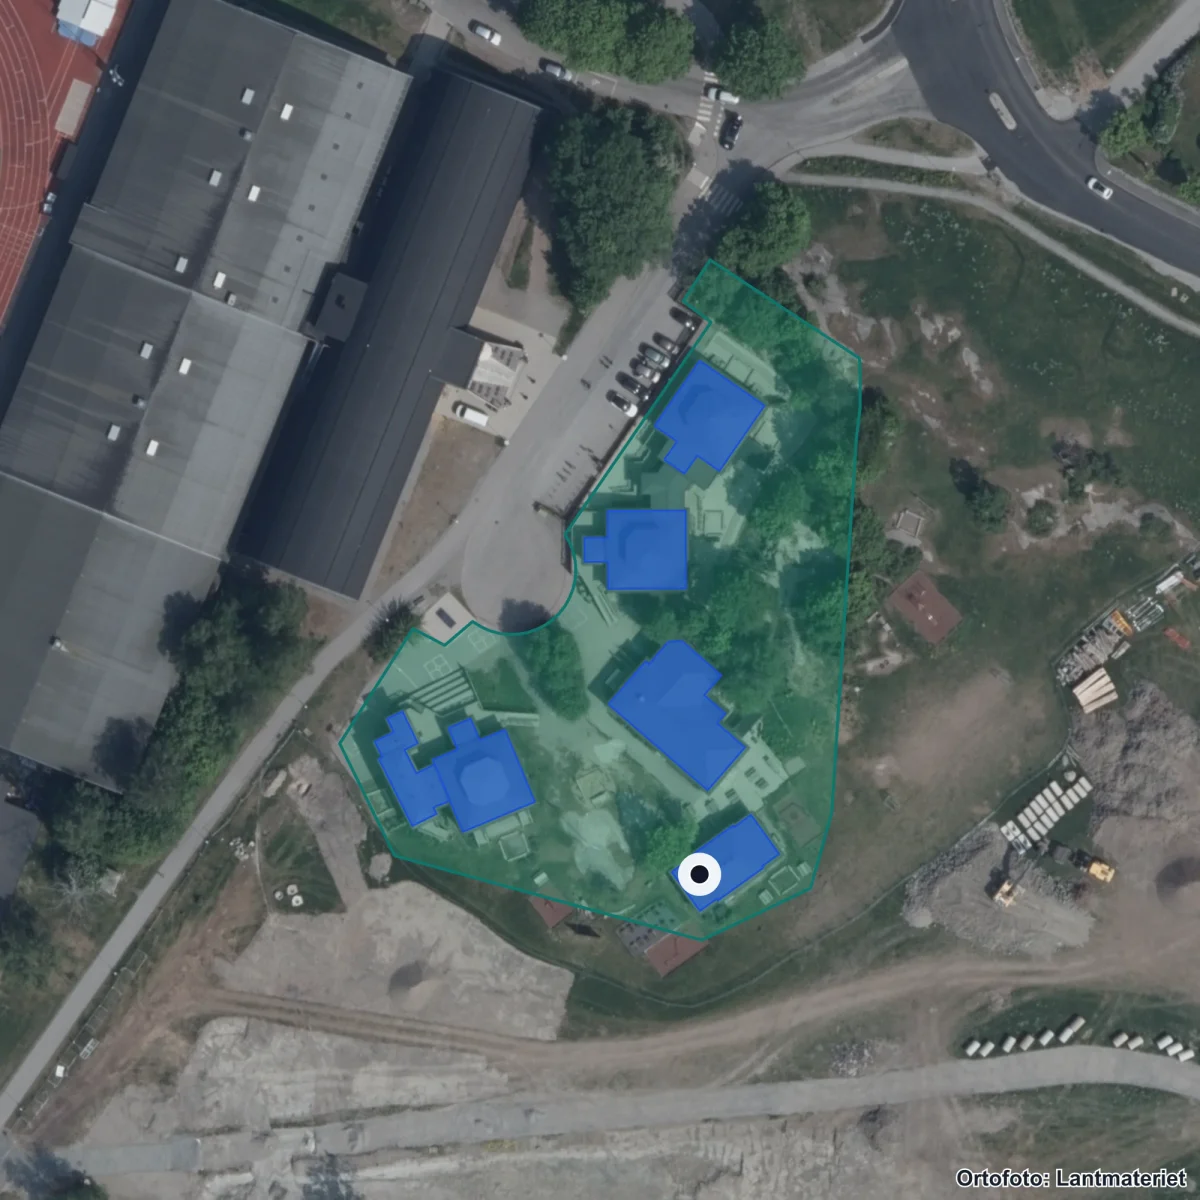
The school's property boundary and buildings from the Swedish Land Survey's property register. Updated 2026. Source: Lantmäteriet · CC BY 4.0
Entrances:1 Lidingö, Kyrkviksstigen 7, Lidingö
School performance
Staff
46%Qualified teachersMunicipality: 75% · Sweden: 72%
Staff
46%
Qualified teachers
46% of teachers hold a pedagogical degree — 26 percentage points below the national average.
- Qualified teachers Reliability: High reliability.
- 46%From 37% (2425) to 46% (2526)Municipality: 75% · Sweden: 72%
- Pupils per teacher Reliability: High reliability.
- 10.3From 10.0 (2425) to 10.3 (2526)Municipality: 13.5 · Sweden: 12.0
- Permanently employed Reliability: Moderate reliability.
- 100%
- Senior teachers (förstelärare) Reliability: Moderate reliability.
- —Data missing — the Swedish National Agency for Education has not published this value.
- Certified in their teaching subject Reliability: Moderate reliability.
- 37%
- Teachers (FTE) Reliability: Moderate reliability.
- 8.4
- Share of female teachers Reliability: Moderate reliability.
- 94%
- Teacher turnover Reliability: Moderate reliability.
- 10%
Moderate reliability — Mixed sources: certification + student/teacher ratio reported directly to Skolverket; other personnel fields from Skolverket's annual Personal report (1-2 year data lag).
School environment
Safety & Inspection
1 openRecently inspected 2012Safety index: 92 / 100
Safety & Inspection
1 open
Recently inspected 2012
1 open remark(s) from the Schools Inspectorate.
- Latest inspection decision Reliability: High reliability.
- 2012-06-20 — Regelb. tillsyn Skolbeslut Lidingö I Ur och Skur Utsikten skola, 2012 (pdf, 487 kB)
- Open remarks Reliability: High reliability.
- 1
- Safety index Reliability: High reliability.
- 92 / 100Safety: 96% · Study peace: 86% · Anti-bullying: 97% · Staff: 86%
Safety index
92/ 100(High data coverage)
- Safety96%(national 82)
- Study peace86%(national 57)
- Anti-bullying97%(national 65)
- Staff86%(no national figure)
School Survey — all perspectives
| Dimension | Pupils (åk 5) | Guardian | Staff |
|---|---|---|---|
| Safety | 9.6 / 10 | — | — |
| Study environment | 8.6 / 10 | — | — |
| Anti-bullying | 9.7 / 10 | — | — |
| Stimulation | 8.5 / 10 | — | — |
| Support | 9.1 / 10 | — | — |
Scale 0–10 (rescaled from Skolverket's 0–100). Guardian and staff perspectives are often not in open data.
High reliability — Inspection register and Skolenkäten survey.
Source: Schools Inspectorate + Skolverket · Last updated: 5 Jul 2026
Resources
129,633 SEKCost per pupil (total)Sweden: 144,179 SEK
Resources
129,633 SEK
Cost per pupil (total)
Cost per pupil is 10% below the national average.
Limited history — Cost data updated annually by Kolada/SCB.
Who runs the school
Operator
I UR OCH SKUR UTSIKTEN EKONOMISK FÖRENINGIndependent operator68 other schools in the municipality.
Operator
I UR OCH SKUR UTSIKTEN EKONOMISK FÖRENING
Independent operator
I UR OCH SKUR UTSIKTEN EKONOMISK FÖRENING operates this school independently.
- Operator Reliability: High reliability.
- I UR OCH SKUR UTSIKTEN EKONOMISK FÖRENING
- Operating form Reliability: High reliability.
- Independent
- Other schools in municipality Reliability: High reliability.
- 68
High reliability — Current data from Skolverket and Bolagsverket.
Source: Skolverket · Last updated: 5 Jul 2026
Next step: Apply for a place
Apply through Lidingö e-service for school choice.
Contact and address
- Headmaster
- Charlotta Bürger Hyllienmark
- Visiting address
- Kyrkviksstigen 3-9, 18146 Lidingö
- Postal address
- Kyrkvikstigen 3-9, 18146 LIDINGÖ
- Phone
- 073-9780116
- School unit code
36185466
Source: Skolverket School Unit Register · Pipeline-fetched on 2026-07-05.
Everyday travelAreas that reach the school within 15 minutes.
Reachability from the school
15 min on foot
15 min by bike
School
Daily-life profile
Everyday life at the school
Everyday facts are shown with a source where available. Fields not yet collected are listed together and do not affect score or ranking.
Not collected yet: School day times, After-school care, Language choices, Food and dining, Facilities and outdoor environment, Homework and study support. Suggest an addition →
Nearest and similar schools
- Ingridskolan, grundskola7 km away· 80 pupils
- Vendestigens skola6 km away· 60 pupils
- Vittra Luma Park8 km away· 50 pupils

About Lidingö municipality
School-form averages across the municipality, with links to deep-dive sub-pages.
- Schools
- 69
- Avg. merit (yr 9)
- 258.1+30.4
- Certified teachers
- 76%in line
- Pupils per teacher
- 13.3+1.3
Source: Skolverket (aggregated school statistics).
Similar schools
The 5 most-similar compulsory schools based on student count, geography, teacher certification and pupil composition.
Pupils per year
Number of pupils per year group (total 81 pupils). Latest available year from Skolverket (SIRIS).
★ Watch I Ur och Skur Utsikten
Get email when new statistics are published, merit value changes significantly or the School Inspectorate makes a new decision.
Want to dig deeper?
The Data view shows complete history, sources, methodology and CSV export.
In-depth metrics
Staff stability
Improving
Source: Kolada (municipality-aggregated certified teacher trend).
Throughput year 6 → year 9
100.0% year 6 (year 9 missing)
- 11 pupils yr 6
Source: Skolverket SIRIS + Skolverket Statistical Database.
Safety and study environment (SkolenkätenThe Schools Inspectorate’s survey sent to pupils, parents, and staff about safety, classroom order, and teaching.Read more in glossary →)
The school survey shows pupil experience where responses are available. Read values together with year, response coverage and unknowns.
Coverage: 1 displayed year group · year 2026.
Strongest (Year 5)
- Anti-bullying: 97 (national 65)
- Safety: 96 (national 82)
Weakest (Year 5)
- Stimulation: 85 (national 66)
- Study environment: 86 (national 57)
Support-needs policy · School-choice guide
Source: Skolinspektionen Skolenkäten 2026. Updated annually. · See all years and dimensions in the data view →
School meals
Weekly menus and meal provider for this school's municipality.
No menu provider registered for this municipality yet.
Source: municipality's own meal portal — Skolkoll does not host menu content.
Inspections & decisions
Source: Skolinspektionen tillsynsregister (open data). Updated when new decisions are published. · See all decisions and review types in the data view → · Check current status at the Schools Inspectorate ↗
Explore further
More context about I Ur och Skur Utsikten, its municipality, operator and similar schools.
Compulsory schools in LidingöSee all compulsory schools in the municipality with results and comparisons.Schools in LidingöOpen the municipality page with all schools, rankings, and local aggregates.I Ur Och Skur Utsikten Ekonomisk FöreningSee all schools, municipalities, and core metrics for the same provider.Stockholms länCompare municipalities and school patterns across the whole county.Merit value year 9Compare year-9 merit values across municipalities and school environments.Certification vs Merit valueSee how merit values and upper-secondary eligibility move together.School size by school typeSee how school forms and unit sizes are distributed nationally.School type distributionCompare how school forms are distributed across municipalities and operators.
Data coverage
What we do not know about I Ur och Skur Utsikten
Open school data is not complete. Use this as a checklist for what to verify with the school, provider or municipality.
- MediumResults and score inputsMedium data coverage: 3 of 5 score dimensions have school-specific data. When school-specific data is missing for a dimension, the neutral value 50 is used. That does not automatically lower the school, but it makes the score less informative.
- MediumEligibility and goal attainmentGrades, eligibility and goal-attainment data may be missing, suppressed or available only for some grades and school types.
- UncertainResources, teachers and staffTeacher and resource metrics do not always show subject mix, vacancies, student-health workflows or everyday staffing.
- MissingSupport resources and student healthWe do not yet have a verified national data source for special education, student health, adaptations, language support or contact routes per school.
- PartialSafety and study environmentThe school survey is shown where available, but not every grade and perspective is always covered.
- UncertainAdmissions, placement and important datesMunicipal placement rules, queues and important dates require a local source and should be checked with the municipality or school.
- MissingVisits, facilities and everyday environmentWe lack sourced open-house information for this school. Facilities, accessibility and everyday environment are often not open comparable data.
For the school: get your Skolkoll badge
Work at this school? Embed an image showing the school's Skolkoll score that links to the full profile. The image is served from Skolkoll's image host and updates when we publish a new badge for the school.
See Data view for full sources and fetch dates per source.