Staff stability
Improving
Source: Kolada (municipality-aggregated certified teacher trend).
Headmaster: Anna Dahlson

Vuxenutbildningen i Karlsborg och Karlsborgs gymnasieskola is a small municipal upper secondary school with 20 pupils.
Vuxenutbildningen i Karlsborg och Karlsborgs gymnasieskola is a small municipal upper secondary school with 20 pupils.
Apply for a place? Use Karlsborg e-service for upper-secondary application (opens in a new window).
This applies only to the values listed here.
This value is missing in full or in part.
This affects
Other values here do not have this specific note.
No clear attention flags from key-figure deviations or the School Inspectorate's public register. Detailed inspection history is shown in the "Safety & Inspection" card below.
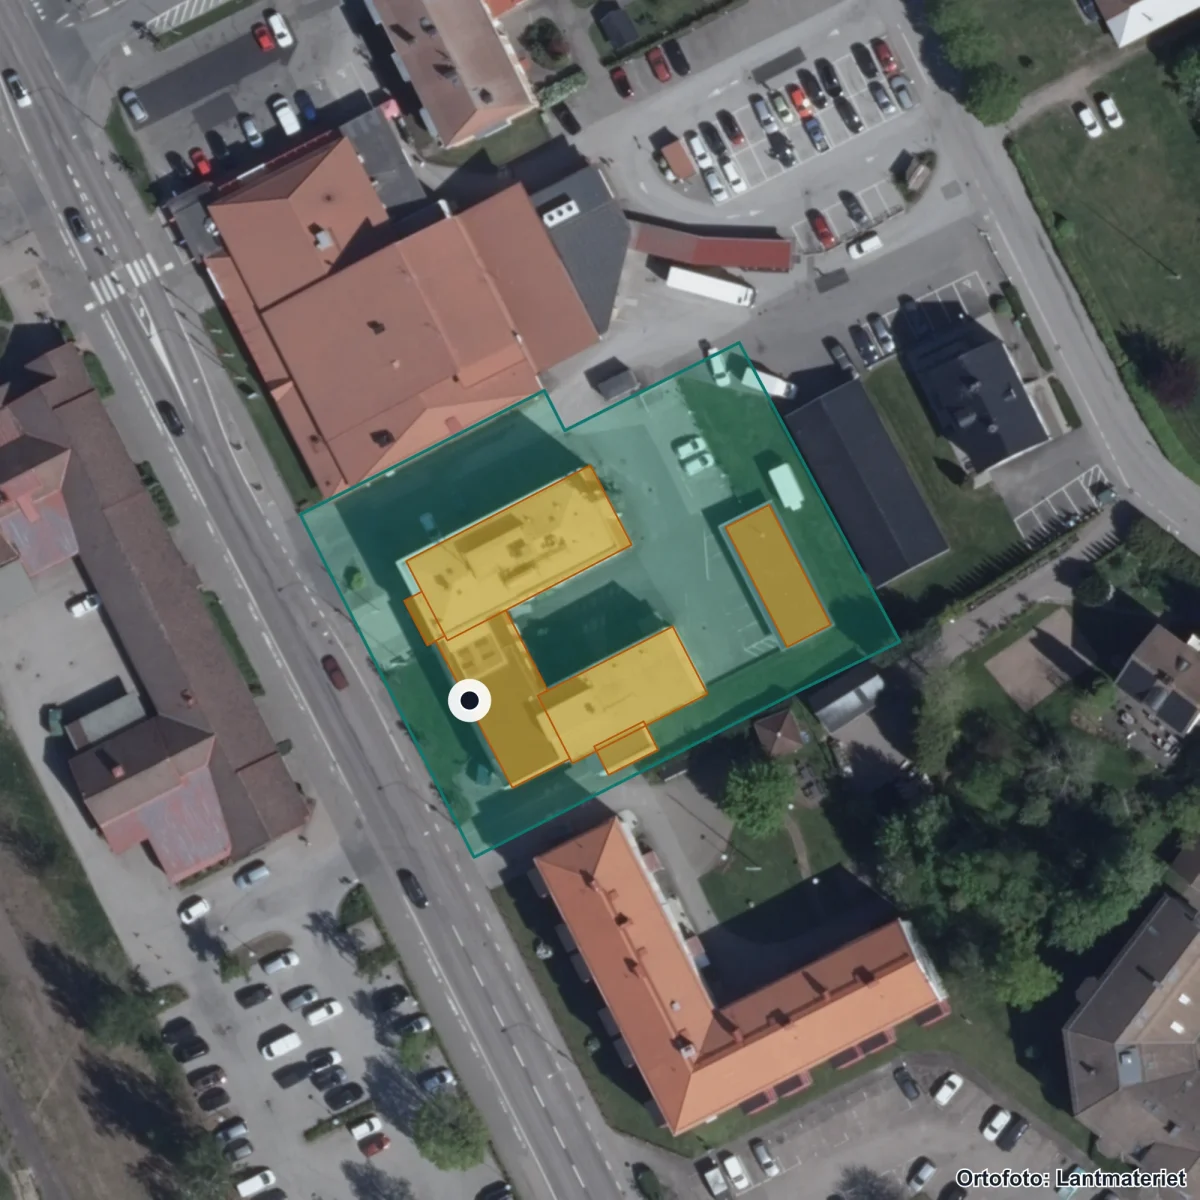
Aerial view of the school's surroundings. The property is marked from the register; building use has not been verified. Updated 2026. Source: Lantmäteriet · CC BY 4.0
Entrances:1 Karlsborg, Storgatan 16, Karlsborg
Staff data reported by the school operator.
Source: Skolverket · Last updated: 5 Jul 2026
No open remarks from the Schools Inspectorate.
Source: Schools Inspectorate + Skolverket · Last updated: 5 Jul 2026
Sweden: 144,179 SEK
Cost per pupil is 8% above the national average.
10 other schools in the municipality.

KARLSBORGS KOMMUN is the operator. The municipality has 10 other schools.
Source: Skolverket · Last updated: 5 Jul 2026
Apply through Karlsborg e-service for upper-secondary application.
55870331Source: Skolverket School Unit Register · Pipeline-fetched on 2026-07-05.
Everyday travelAreas that reach the school within 15 minutes.
School-form averages across the municipality, with links to deep-dive sub-pages.
Source: Skolverket (aggregated school statistics).
The 5 most-similar upper secondary schools based on student count, geography, teacher certification and pupil composition.
Get email when new statistics are published, merit value changes significantly or the School Inspectorate makes a new decision.
The Data view shows complete history, sources, methodology and CSV export.
Source: Kolada (municipality-aggregated certified teacher trend).
Weekly menus and meal provider for this school's municipality.
No menu provider registered for this municipality yet.
Source: municipality's own meal portal — Skolkoll does not host menu content.
Applicants per place and latest admission cutoff per programme (2026).
High demand reflects popularity, which depends on location and reputation as well as quality. Cutoffs measure entry difficulty, not school quality.
Source: Gymnasieantagningen (regional admission databases). Latest year: 2026.
More context about Vuxenutbildningen i Karlsborg och Karlsborgs gymnasieskola, its municipality, operator and similar schools.
Data coverage
Open school data is not complete. Use this as a checklist for what to verify with the school, provider or municipality.
See Data view for full sources and fetch dates per source.