OneSchool Global Nyby Campus Gymnasium in Hylte
Headmaster: Douglas McPherson
68
Skolkoll Score 68 out of 100. The scale goes from 0 (lowest) to 100 (highest). 50 is the average. This school performs near average.Near averageCompared to all upper-secondary schools nationally
Limited confidence: the sample is small, so the score may vary more than usual.
A composite of five open data sources — a starting point, not a grade.
Data coverageMedium2/5
Why this score?
Skolkoll score is Skolkoll's composite indicator based on available data sources. It is not an official quality measure and should be read together with the underlying data.
2 of 5 score dimensions have school-specific data. The pupil sample is limited.
When school-specific data is missing for a dimension, the neutral value 50 is used. That does not automatically lower the school, but it makes the score less informative.
OneSchool Global Nyby Campus Gymnasium is a small group-operated upper secondary school with 20 pupils.
OneSchool Global Nyby Campus Gymnasium is a small group-operated upper secondary school with 20 pupils.
- 20PupilsMunicipality: 70High reliability
- 16.4Graduation gradeMunicipality: 16.4 · Sweden: 13.8Moderate reliability
- 4.6Pupils per teacherMunicipality: 4.9 · Sweden: 12.1High reliability
- 183,521 SEKCost per pupil (municipal avg.)Sweden: 144,179 SEKLimited history
See how schools in Hylte rank →
The most important facts in 3 points
- Upper secondary school in Hylte with 20 pupils.
- The latest inspection (2023) has no recorded deficiencies in our data.
- Applying? Go to the school's application link on this page.
Skolkoll interpretation
OneSchool Global Nyby Campus Gymnasium is compared here with 1 other school with the same school form in Hylte municipality; it has 20 pupils versus the municipal average of 35.
The average graduation grade is 16.4, in line with the municipal average and 2.6 points above the national average.
Pupils per teacher is 4.6, 0.3 lower than the municipal average.
Apply for a place? Use Hylte e-service for upper-secondary application (opens in a new window).
School programmes
- Upper secondary school
Things to look into
No clear flag.
No clear attention flags from key-figure deviations or the School Inspectorate's public register. Detailed inspection history is shown in the "Safety & Inspection" card below.
School profile
The school's strengths compared with all upper-secondary schools nationally.
- Grade pointsP94
- Pupil-teacher ratioP98
- Eligibility (higher education)P56
- Graduated within 3 yearsP73
Source: Skolverket, Swedish Schools Inspectorate.
Aerial view of the school
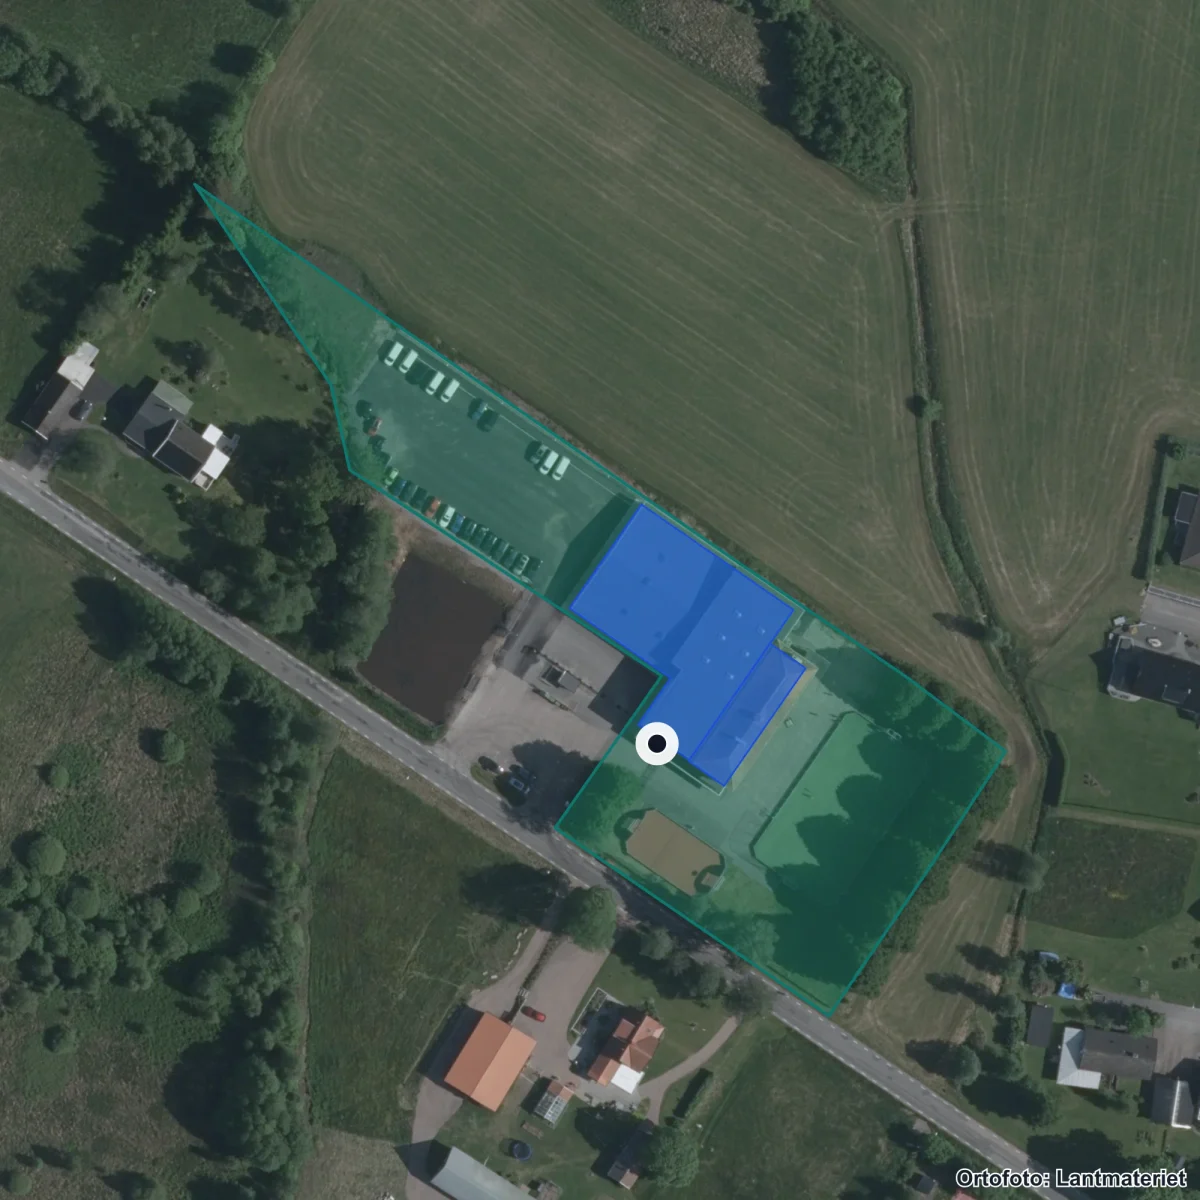
The school's property boundary and buildings from the Swedish Land Survey's property register. Updated 2026. Source: Lantmäteriet · CC BY 4.0
Entrances:1 Hylte, Nybyvägen 6, Långaryd
School performance
Results
16.4Avg. graduation gradeSweden: 13.8
Results
16.4
Avg. graduation grade
Average graduation grade is 2.6 points above the national average.
Moderate reliability — Direct data from the school operator.
Staff
4.6Pupils per teacherMunicipality: 4.9 · Sweden: 12.1
Staff
4.6
Pupils per teacher
Staff data reported by the school operator.
High reliability — Reported directly by the school operator.
School environment
Safety & Inspection
3 openRecently inspected 2023
Safety & Inspection
3 open
Recently inspected 2023
3 open remark(s) from the Schools Inspectorate.
- Latest inspection decision Reliability: High reliability.
- 2023-05-05 — Riktad tillsyn Uppföljning skolbeslut Gymnasieskolan Hylte OneSchool Global Nyby Campus Gymnasium, 2023 (pdf, 836 kB)
- Open remarks Reliability: High reliability.
- 3
High reliability — Inspection register and Skolenkäten survey.
Source: Schools Inspectorate + Skolverket · Last updated: 5 Jul 2026
Resources
183,521 SEKCost per pupil (total)Sweden: 144,179 SEK
Resources
183,521 SEK
Cost per pupil (total)
Cost per pupil is 27% above the national average.
Limited history — Cost data updated annually by Kolada/SCB.
Who runs the school
Operator
OneSchool Global Nyby Campus ABGroup operator22 other schools in the municipality.
Operator
OneSchool Global Nyby Campus AB
Group operator
OneSchool Global Nyby Campus AB operates this school as part of a larger concern.
- Operator Reliability: High reliability.
- OneSchool Global Nyby Campus AB
- Operating form Reliability: High reliability.
- Group-operated
- Concern (parent organisation) Reliability: High reliability.
- OneSchool Global Nyby Campus AB
- Concern org. number Reliability: High reliability.
- 5566657515
- Other schools in municipality Reliability: High reliability.
- 22
High reliability — Current data from Skolverket and Bolagsverket.
Source: Skolverket · Last updated: 5 Jul 2026
Next step: Apply for a place
Apply through Hylte e-service for upper-secondary application.
Contact and address
- Headmaster
- Douglas McPherson
- Visiting address
- Nybyvägen 6, 31492 Långaryd
- Postal address
- Nybyvägen 6, 31492 LÅNGARYD
- Phone
- 0371-46066
- Website
- www.oneschoolglobal.com/
- School unit code
43826783
Source: Skolverket School Unit Register · Pipeline-fetched on 2026-07-05.
Everyday travelAreas that reach the school within 15 minutes.
Reachability from the school
15 min on foot
15 min by bike
School
Daily-life profile
Everyday life at the school
Everyday facts are shown with a source where available. Fields not yet collected are listed together and do not affect score or ranking.
Not collected yet: School day times, After-school care, Language choices, Food and dining, Facilities and outdoor environment, Homework and study support. Suggest an addition →
Nearest and similar schools
- Hylte gymnasieskola8 km away· 50 pupils
- Stora Segerstadsgymnasiet12 km away· 160 pupils
- Motorsportsgymnasiet i Anderstorp29 km away· 110 pupils

About Hylte municipality
School-form averages across the municipality, with links to deep-dive sub-pages.
- Schools
- 23
- Avg. merit (yr 9)
- 216.2−11.5
- Certified teachers
- 56%−18 pp
- Pupils per teacher
- 9.6−2.4
Source: Skolverket (aggregated school statistics).
Similar schools
The 5 most-similar upper secondary schools based on student count, geography, teacher certification and pupil composition.
Hylte gymnasieskola
Hylte
Merit: —Cert: 24%50 pupils
Stora Segerstadsgymnasiet
Gislaved
Merit: —Cert: 72%160 pupils
Motorsportsgymnasiet i Anderstorp
Gislaved
Merit: 12.9Cert: —110 pupils
Sunnerbogymnasiet 4
Ljungby
Merit: —Cert: —70 pupils
Gislaveds gymnasium Utvecklingssektor
Gislaved
Merit: —Cert: 58%180 pupils
★ Watch OneSchool Global Nyby Campus Gymnasium
Get email when new statistics are published, merit value changes significantly or the School Inspectorate makes a new decision.
Want to dig deeper?
The Data view shows complete history, sources, methodology and CSV export.
In-depth metrics
Staff stability
Improving
Source: Kolada (municipality-aggregated certified teacher trend).
School meals
Weekly menus and meal provider for this school's municipality.
No menu provider registered for this municipality yet.
Source: municipality's own meal portal — Skolkoll does not host menu content.
Inspections & decisions
Source: Skolinspektionen tillsynsregister (open data). Updated when new decisions are published. · See all decisions and review types in the data view → · Check current status at the Schools Inspectorate ↗
Admissions pressure & cutoffs
Applicants per place and latest admission cutoff per programme (2026).
High demand reflects popularity, which depends on location and reputation as well as quality. Cutoffs measure entry difficulty, not school quality.
- Ekonomiprogrammet
Source: Gymnasieantagningen (regional admission databases). Latest year: 2026.
Graduation rate within 3 years
92%graduate within 3 years
Not graduated8%
vs national avg.10 percentage points above national average (82%)
Source: Skolverket (graduation rate within 3 years). Updated annually.
After upper secondary
Source: Skolverket (higher-education eligibility).
Explore further
More context about OneSchool Global Nyby Campus Gymnasium, its municipality, operator and similar schools.
Upper secondary schools in HylteSee all upper secondary schools in the municipality with graduation rates.Schools in HylteOpen the municipality page with all schools, rankings, and local aggregates.OneSchool Global Nyby Campus ABSee all schools, municipalities, and core metrics for the same provider.OneSchool Global Nyby Campus ABOpen the full school-group page with providers, municipalities, and group totals.Hallands länCompare municipalities and school patterns across the whole county.Upper secondary schoolsGet the national upper-secondary overview of school size and outcomes.Cost vs ResultsCompare outcomes and resource levels across municipalities and school markets.Compare schoolsBuild a side-by-side comparison with the schools you care about.
Data coverage
What we do not know about OneSchool Global Nyby Campus Gymnasium
Open school data is not complete. Use this as a checklist for what to verify with the school, provider or municipality.
- MediumResults and score inputsMedium data coverage: 2 of 5 score dimensions have school-specific data. The pupil sample is limited. When school-specific data is missing for a dimension, the neutral value 50 is used. That does not automatically lower the school, but it makes the score less informative.
- MediumEligibility and goal attainmentGrades, eligibility and goal-attainment data may be missing, suppressed or available only for some grades and school types.
- UncertainResources, teachers and staffTeacher and resource metrics do not always show subject mix, vacancies, student-health workflows or everyday staffing.
- MissingSupport resources and student healthWe do not yet have a verified national data source for special education, student health, adaptations, language support or contact routes per school.
- MissingSafety and study environmentWe lack current or displayable survey data about safety and study environment for this school.
- PartialAdmissions, placement and important datesAdmission data is available for upper-secondary programmes where sources publish it, but it is historical and not a forecast.
- MissingVisits, facilities and everyday environmentWe lack sourced open-house information for this school. Facilities, accessibility and everyday environment are often not open comparable data.
See Data view for full sources and fetch dates per source.