top 36%Shows where a school sits within a comparison group. Percentile 80 means the school ranks above roughly 80 percent of that group.Compared to all upper-secondary schools nationally
0median100
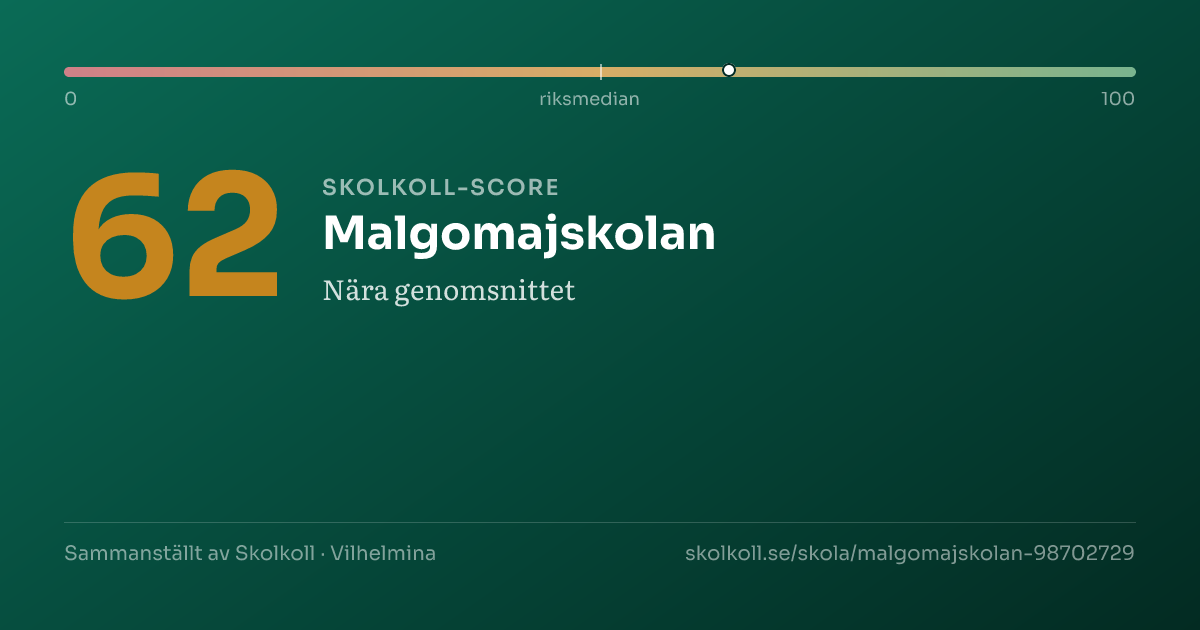
Skolkoll Score 62 out of 100. The scale goes from 0 (lowest) to 100 (highest). 50 is the average. Better than 64% of Sweden’s upper secondary schools.
A composite of five open data sources — a starting point, not a grade.
Data coverageMedium3/5
Why this score?
Skolkoll score is Skolkoll's composite indicator based on available data sources. It is not an official quality measure and should be read together with the underlying data.
3 of 5 score dimensions have school-specific data.
When school-specific data is missing for a dimension, the neutral value 50 is used. That does not automatically lower the school, but it makes the score less informative.
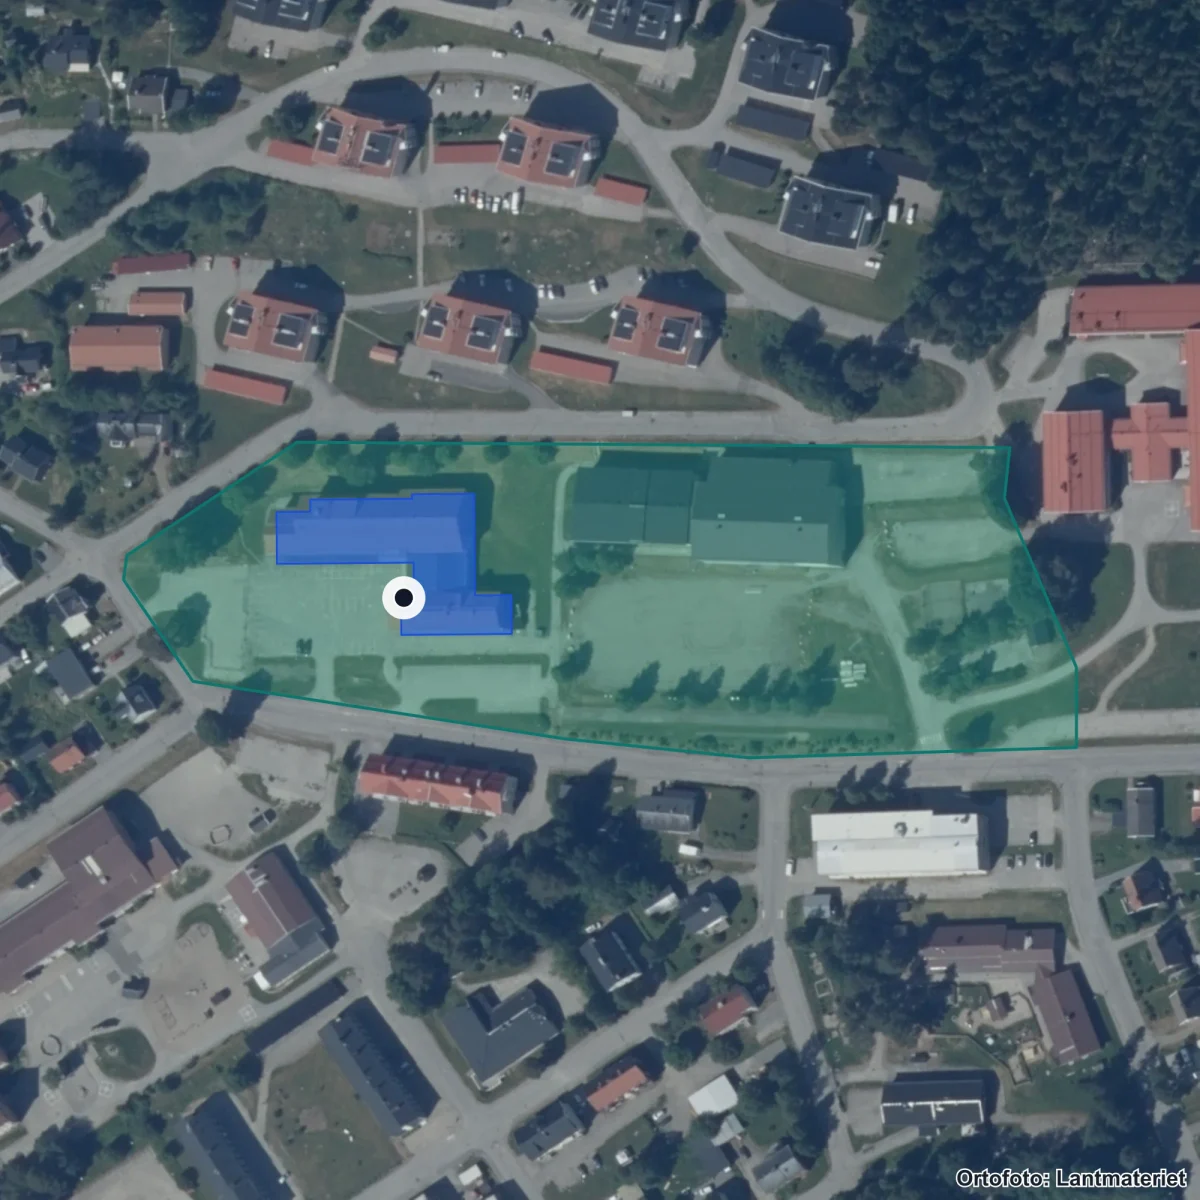
Malgomajskolan is compared here with 1 other school with the same school form in Vilhelmina municipality; it has 180 pupils versus the municipal average of 130.
The average graduation grade is 14.2, in line with the municipal average and 0.4 points above the national average.
Pupils per teacher is 7.4, 2.0 higher than the municipal average.
Independent school data for all of Sweden
SCHOOL REPORT
Malgomajskolan
Upper secondary school · Vilhelmina, Västerbottens County
Provider: Södra Lapplands Gymnasieförbund · School unit code: 98702729
Statistics: school year 2024/25 · Updated 2026-07-05
No clear attention flags from key-figure deviations or the School Inspectorate's public register. Detailed inspection history is shown in the "Safety & Inspection" card below.
School profile
The school's strengths compared with all upper-secondary schools nationally.
Safety and study environment (SkolenkätenThe Schools Inspectorate’s survey sent to pupils, parents, and staff about safety, classroom order, and teaching.Read more in glossary →)
The school survey shows pupil experience where responses are available. Read values together with year, response coverage and unknowns.
Open school data is not complete. Use this as a checklist for what to verify with the school, provider or municipality.
MediumResults and score inputsMedium data coverage: 3 of 5 score dimensions have school-specific data. When school-specific data is missing for a dimension, the neutral value 50 is used. That does not automatically lower the school, but it makes the score less informative.
MediumEligibility and goal attainmentGrades, eligibility and goal-attainment data may be missing, suppressed or available only for some grades and school types.
UncertainResources, teachers and staffTeacher and resource metrics do not always show subject mix, vacancies, student-health workflows or everyday staffing.
MissingSupport resources and student healthWe do not yet have a verified national data source for special education, student health, adaptations, language support or contact routes per school.
PartialSafety and study environmentThe school survey is shown where available, but not every grade and perspective is always covered.
PartialAdmissions, placement and important datesAdmission data is available for upper-secondary programmes where sources publish it, but it is historical and not a forecast.
MissingVisits, facilities and everyday environmentWe lack sourced open-house information for this school. Facilities, accessibility and everyday environment are often not open comparable data.
Places, admission and support are decided by the school, provider or municipality. Use this as a checklist, not a promise of outcome.
For the school: get your Skolkoll badge
Work at this school? Embed an image showing the school's Skolkoll score that links to the full profile. The image is served from Skolkoll's image host and updates when we publish a new badge for the school.
Data sources: Skolverket, Kolada (RKA/SKR), SCB · Updated 2026-07-05
Method
About this value
Cookie settings
We use cookies for visitor statistics, A/B testing and site improvement (Google Analytics 4 with IP anonymization and Zoho PageSense, which may include heatmaps and session recording on public pages). Skolkoll does not sell visitor data and shows no advertising. Read more in our privacy policy