Lilla Parkskolan in Södertälje
Headmaster: Frida Sörlisten
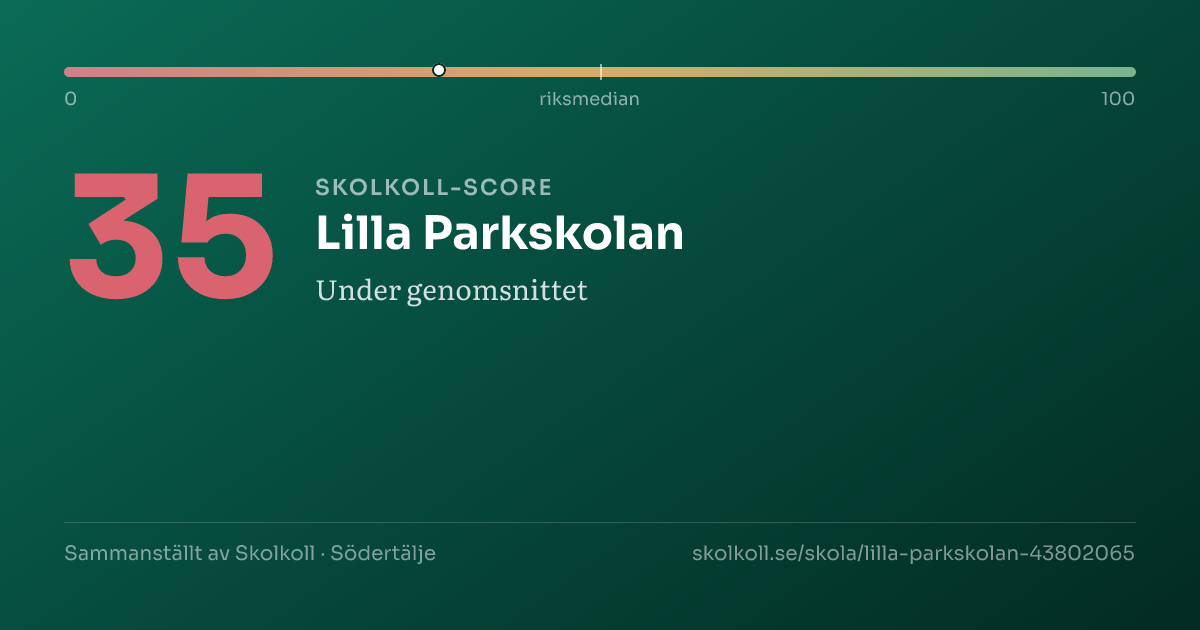
35
Skolkoll Score 35 out of 100. The scale goes from 0 (lowest) to 100 (highest). 50 is the average. Better than 50% of Sweden’s compulsory schools.around the national midpointShows where a school sits within a comparison group. Percentile 80 means the school ranks above roughly 80 percent of that group.Compared to all compulsory schools nationally
A composite of five open data sources — a starting point, not a grade.
Data coverageMedium2/5
Why this score?
Skolkoll score is Skolkoll's composite indicator based on available data sources. It is not an official quality measure and should be read together with the underlying data.
2 of 5 score dimensions have school-specific data.
When school-specific data is missing for a dimension, the neutral value 50 is used. That does not automatically lower the school, but it makes the score less informative.
Lilla Parkskolan is a small group-operated compulsory school with 60 pupils.
Lilla Parkskolan is a small group-operated compulsory school with 60 pupils. The share of qualified teachers (55%) is below the national average of 72%.
- 60PupilsMunicipality: 10,820High reliability
- 55%Qualified teachersMunicipality: 73% · Sweden: 72%High reliability
- 17.4Pupils per teacherMunicipality: 12.1 · Sweden: 12.0High reliability
- 150,870 SEKCost per pupil (municipal avg.)Sweden: 144,179 SEKLimited history
See how schools in Södertälje rank →
The most important facts in 3 points
- Compulsory school in Södertälje with 60 pupils.
- The latest inspection (2019) shows an injunction or fine from the Schools Inspectorate.
- Applying? Go to the school's application link on this page.
Skolkoll interpretation
Lilla Parkskolan is compared here with 33 other schools with the same school form in Södertälje municipality; it has 60 pupils versus the municipal average of 318.
Qualified teachers: 55%, 18 percentage points below the municipal average and 17 percentage points below the national average.
Pupils per teacher is 17.4, 5.3 higher than the municipal average.
Apply for a place? Use Södertälje e-service for school choice (opens in a new window).
Permanently employed teachers and Number of pupils has limited history
This applies only to the values listed here.
There is still too little history to interpret the trend safely.
This affects
- Permanently employed teachers
- Number of pupils
- This staffing metric is affected by FTE definitions, local reporting practices, and temporary vacancies.
- Pupil counts may be privacy-suppressed for small units and are not always updated on the same cadence as other indicators.
Other values here do not have this specific note.
School programmes
- Compulsory school
Things to look into
Worth looking into. These indicators are an attention aid, not a quality grade or risk score.
- 55% qualified teachers — more than 10 percentage points below the national average (72%).
- 17.4 pupils per teacher — more than 3 above the national average (12.0).
School profile
The school's strengths compared with all primary schools nationally.
- Certified teachersP10
- Pupil-teacher ratioP3
Source: Skolverket, Swedish Schools Inspectorate.
Aerial view of the school
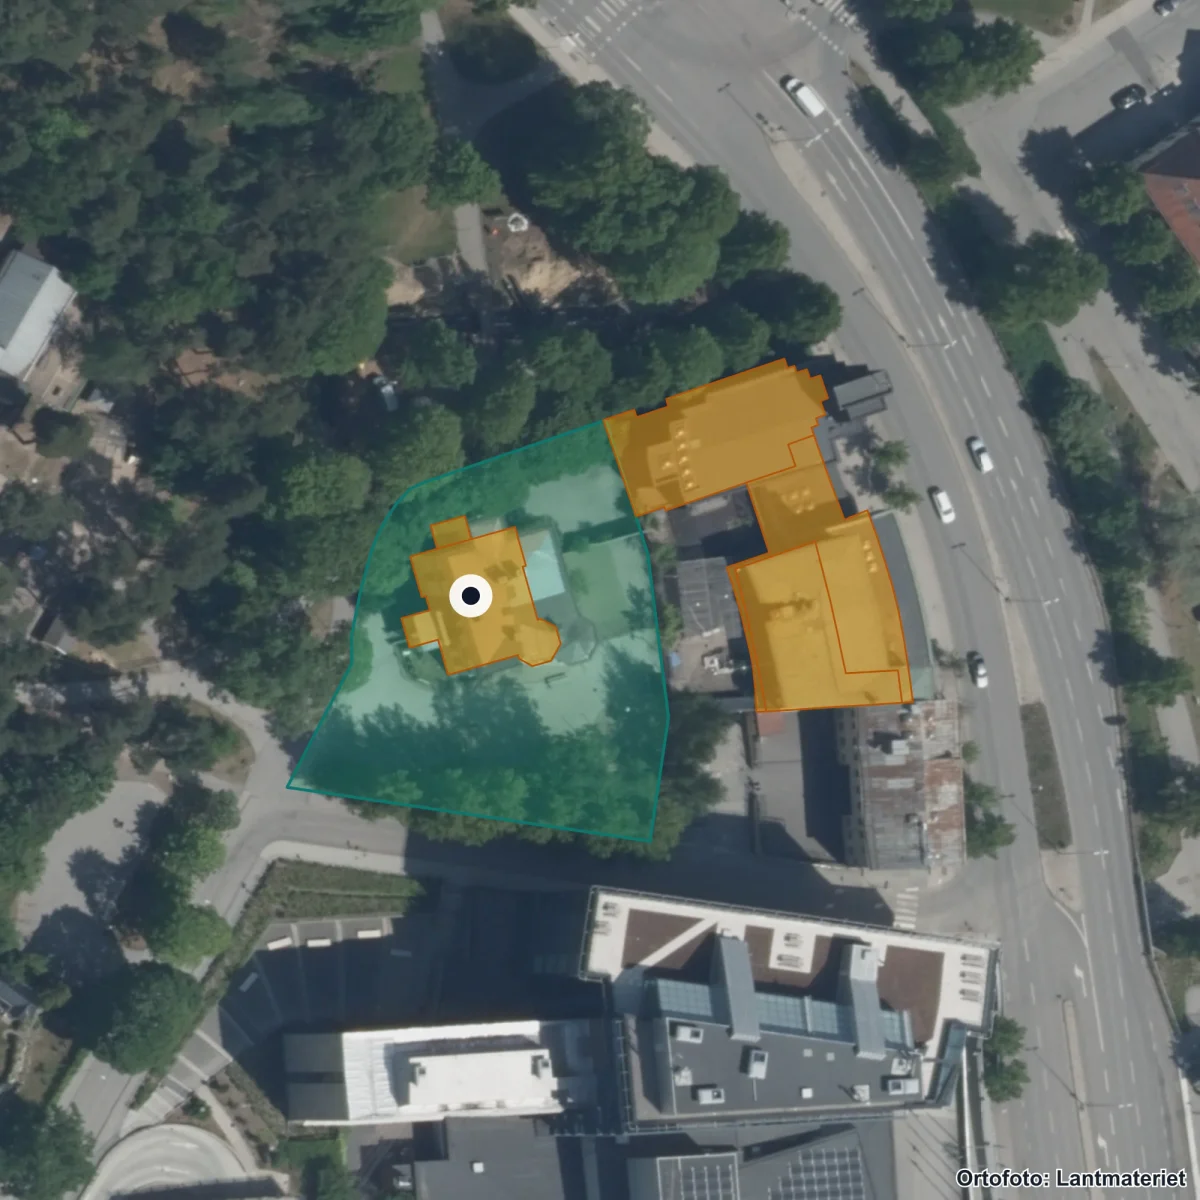
Aerial view of the school's surroundings. The property is marked from the register; building use has not been verified. Updated 2026. Source: Lantmäteriet · CC BY 4.0
Entrances:1 Södertälje, Parkgatan 1, Södertälje
School performance
Staff
55%Qualified teachersMunicipality: 73% · Sweden: 72%
Staff
55%
Qualified teachers
55% of teachers hold a pedagogical degree — 18 percentage points below the national average.
- Qualified teachers Reliability: High reliability.
- 55%From 36% (2425) to 55% (2526)Single cohort, uncertain basisMunicipality: 73% · Sweden: 72%
- Pupils per teacher Reliability: High reliability.
- 17.4From 10.8 (2425) to 17.4 (2526)Single cohort, uncertain basisMunicipality: 12.1 · Sweden: 12.0
- Permanently employed Reliability: Moderate reliability.
- 56%
- Senior teachers (förstelärare) Reliability: Moderate reliability.
- —Data missing — the Swedish National Agency for Education has not published this value.
- Certified in their teaching subject Reliability: Moderate reliability.
- 36%
- Teachers (FTE) Reliability: Moderate reliability.
- 5.5
- Share of female teachers Reliability: Moderate reliability.
- 75%
- Teacher turnover Reliability: Moderate reliability.
- 11%
Moderate reliability — Mixed sources: certification + student/teacher ratio reported directly to Skolverket; other personnel fields from Skolverket's annual Personal report (1-2 year data lag).
School environment
Safety & Inspection
3 openRecently inspected 2019
Safety & Inspection
3 open
Recently inspected 2019
3 open remark(s) from the Schools Inspectorate.
- Latest inspection decision Reliability: High reliability.
- 2019-03-13 — Regelb. tillsyn Uppföljning beslut Södertälje Elafskolan Vitesföreläggande, 2019 (pdf, 787 kB)
- Open remarks Reliability: High reliability.
- 3
High reliability — Inspection register and Skolenkäten survey.
Source: Schools Inspectorate + Skolverket · Last updated: 5 Jul 2026
Resources
150,870 SEKCost per pupil (total)Sweden: 144,179 SEK
Resources
150,870 SEK
Cost per pupil (total)
Cost per pupil is 5% above the national average.
Limited history — Cost data updated annually by Kolada/SCB.
Who runs the school
Operator
Lilla Park och Min Skola ABGroup operator118 other schools in the municipality.
Operator
Lilla Park och Min Skola AB
Group operator

Lilla Park och Min Skola AB operates this school as part of a larger concern.
- Operator Reliability: High reliability.
- Lilla Park och Min Skola AB
- Operating form Reliability: High reliability.
- Group-operated
- Concern (parent organisation) Reliability: High reliability.
- Lilla Park och Min Skola AB
- Concern org. number Reliability: High reliability.
- 5564559523
- Other schools in municipality Reliability: High reliability.
- 118
High reliability — Current data from Skolverket and Bolagsverket.
Source: Skolverket · Last updated: 5 Jul 2026
Next step: Apply for a place
Apply through Södertälje e-service for school choice.
Contact and address
- Headmaster
- Frida Sörlisten
- Visiting address
- Parkgatan 1, 15132 Södertälje
- Postal address
- c/o C/o Cedergrenska AB, Box 16391, 10327 STOCKHOLM
- Phone
- 08-40028974
- Website
- www.lillaparkskolan.se/
- School unit code
43802065
Source: Skolverket School Unit Register · Pipeline-fetched on 2026-07-05.
Everyday travelAreas that reach the school within 15 minutes.
Reachability from the school
15 min on foot
15 min by bike
School
Daily-life profile
Everyday life at the school
Everyday facts are shown with a source where available. Fields not yet collected are listed together and do not affect score or ranking.
Not collected yet: School day times, After-school care, Language choices, Food and dining, Facilities and outdoor environment, Homework and study support. Suggest an addition →
Nearest and similar schools
- Mikaelgården Läkeped. Institut9 km away· 30 pupils
- Magelungens Grundskola Södertälje2 km away· 20 pupils
- Mora Parks skola11 km away· 10 pupils

About Södertälje municipality
School-form averages across the municipality, with links to deep-dive sub-pages.
- Schools
- 119
- Avg. merit (yr 9)
- 236.2+8.5
- Certified teachers
- 71%in line
- Pupils per teacher
- 11.6in line
Source: Skolverket (aggregated school statistics).
Similar schools
The 5 most-similar compulsory schools based on student count, geography, teacher certification and pupil composition.
School survey perspectives
Pupils, guardians and staff — same school, different answers
Survey results broken down by respondent group on a 0–10 scale. Groups can experience the same school very differently — notable gaps are highlighted below.
PupilsGuardians
Text summary of the chart:
- Pupils: Safety too few responses, Study environment too few responses, Stimulation too few responses, Support too few responses, Anti-bullying too few responses.
- Guardians: Safety too few responses, Study environment too few responses, Stimulation too few responses, Support too few responses.
Results with fewer than 5 responses are shown as “too few responses”.
Automatically flagged gaps
At least one respondent group has too few responses on the overlapping measures, so gaps cannot be calculated.
Staff results are not published per school by Skolinspektionen today, so the staff view appears only when available.
Pupils per year
Number of pupils per year group (total 57 pupils). Latest available year from Skolverket (SIRIS).
★ Watch Lilla Parkskolan
Get email when new statistics are published, merit value changes significantly or the School Inspectorate makes a new decision.
Want to dig deeper?
The Data view shows complete history, sources, methodology and CSV export.
In-depth metrics
Staff stability
Improving
Source: Kolada (municipality-aggregated certified teacher trend).
School meals
Weekly menus and meal provider for this school's municipality.
No menu provider registered for this municipality yet.
Source: municipality's own meal portal — Skolkoll does not host menu content.
Inspections & decisions
Source: Skolinspektionen tillsynsregister (open data). Updated when new decisions are published. · See all decisions and review types in the data view → · Check current status at the Schools Inspectorate ↗
Explore further
More context about Lilla Parkskolan, its municipality, operator and similar schools.
Compulsory schools in SödertäljeSee all compulsory schools in the municipality with results and comparisons.Schools in SödertäljeOpen the municipality page with all schools, rankings, and local aggregates.Lilla Park och Min Skola ABSee all schools, municipalities, and core metrics for the same provider.Lilla Park och Min Skola ABOpen the full school-group page with providers, municipalities, and group totals.Stockholms länCompare municipalities and school patterns across the whole county.Merit value year 9Compare year-9 merit values across municipalities and school environments.Certification vs Merit valueSee how merit values and upper-secondary eligibility move together.School size by school typeSee how school forms and unit sizes are distributed nationally.
Data coverage
What we do not know about Lilla Parkskolan
Open school data is not complete. Use this as a checklist for what to verify with the school, provider or municipality.
- MediumResults and score inputsMedium data coverage: 2 of 5 score dimensions have school-specific data. When school-specific data is missing for a dimension, the neutral value 50 is used. That does not automatically lower the school, but it makes the score less informative.
- MediumEligibility and goal attainmentGrades, eligibility and goal-attainment data may be missing, suppressed or available only for some grades and school types.
- UncertainResources, teachers and staffTeacher and resource metrics do not always show subject mix, vacancies, student-health workflows or everyday staffing.
- MissingSupport resources and student healthWe do not yet have a verified national data source for special education, student health, adaptations, language support or contact routes per school.
- MissingSafety and study environmentWe lack current or displayable survey data about safety and study environment for this school.
- UncertainAdmissions, placement and important datesMunicipal placement rules, queues and important dates require a local source and should be checked with the municipality or school.
- MissingVisits, facilities and everyday environmentWe lack sourced open-house information for this school. Facilities, accessibility and everyday environment are often not open comparable data.
For the school: get your Skolkoll badge
Work at this school? Embed an image showing the school's Skolkoll score that links to the full profile. The image is served from Skolkoll's image host and updates when we publish a new badge for the school.
See Data view for full sources and fetch dates per source.