Kärlekens skola in Halmstad
Headmaster: Sofia Kullgård
Lower results than the pupil intake predictsA statistical model that compares schools’ results with what is expected given the student composition.Read more in glossary →What is value-added?The school's own contribution given its pupil intake (Skolverket's SALSA model) — not a quality guarantee, and not comparable between years.

Kärlekens skola is a small municipal compulsory school.
Kärlekens skola is a small municipal compulsory school. The share of qualified teachers (78%) is above the national average of 72%.
- 78%Qualified teachersMunicipality: 78% · Sweden: 72%High reliability
- 12.8Pupils per teacherMunicipality: 12.2 · Sweden: 12.0High reliability
- 137,744 SEKCost per pupil (municipal avg.)Sweden: 144,179 SEKLimited history
The most important facts in 3 points
- Compulsory school in Halmstad. Pupil count is missing from the latest open data.
- The latest record is a review or decision without risk classification.
- The school is not active in Skolverket's register; check status before choosing.
Skolkoll interpretation
Kärlekens skola is compared here with 41 other schools with the same school form in Halmstad municipality.
Qualified teachers: 78%, in line with the municipal average and 6 percentage points above the national average.
The SALSA residual (-16.0) indicates that outcomes are weaker than the model expects for the pupil composition.
Pupils per teacher is 12.8, 0.6 higher than the municipal average.
4 values need extra caution
This applies only to the values listed here.
This value is missing in full or in part.
This affects
- Eligible for vocational programmes
- Merit score year 9
- SALSA score
- Number of pupils
- This result metric can be affected by privacy suppression, small cohorts, and changes in pupil composition between years.
- SALSA is model-based and becomes less stable for small pupil groups or schools with rapidly changing pupil composition.
- Pupil counts may be privacy-suppressed for small units and are not always updated on the same cadence as other indicators.
Other values here do not have this specific note.
School programmes
- Compulsory school
Things to look into
Worth looking into. These indicators are an attention aid, not a quality grade or risk score.
- Merit value is 16 points lower than expected given pupil composition (SALSA score: -16.0).
Aerial view of the school
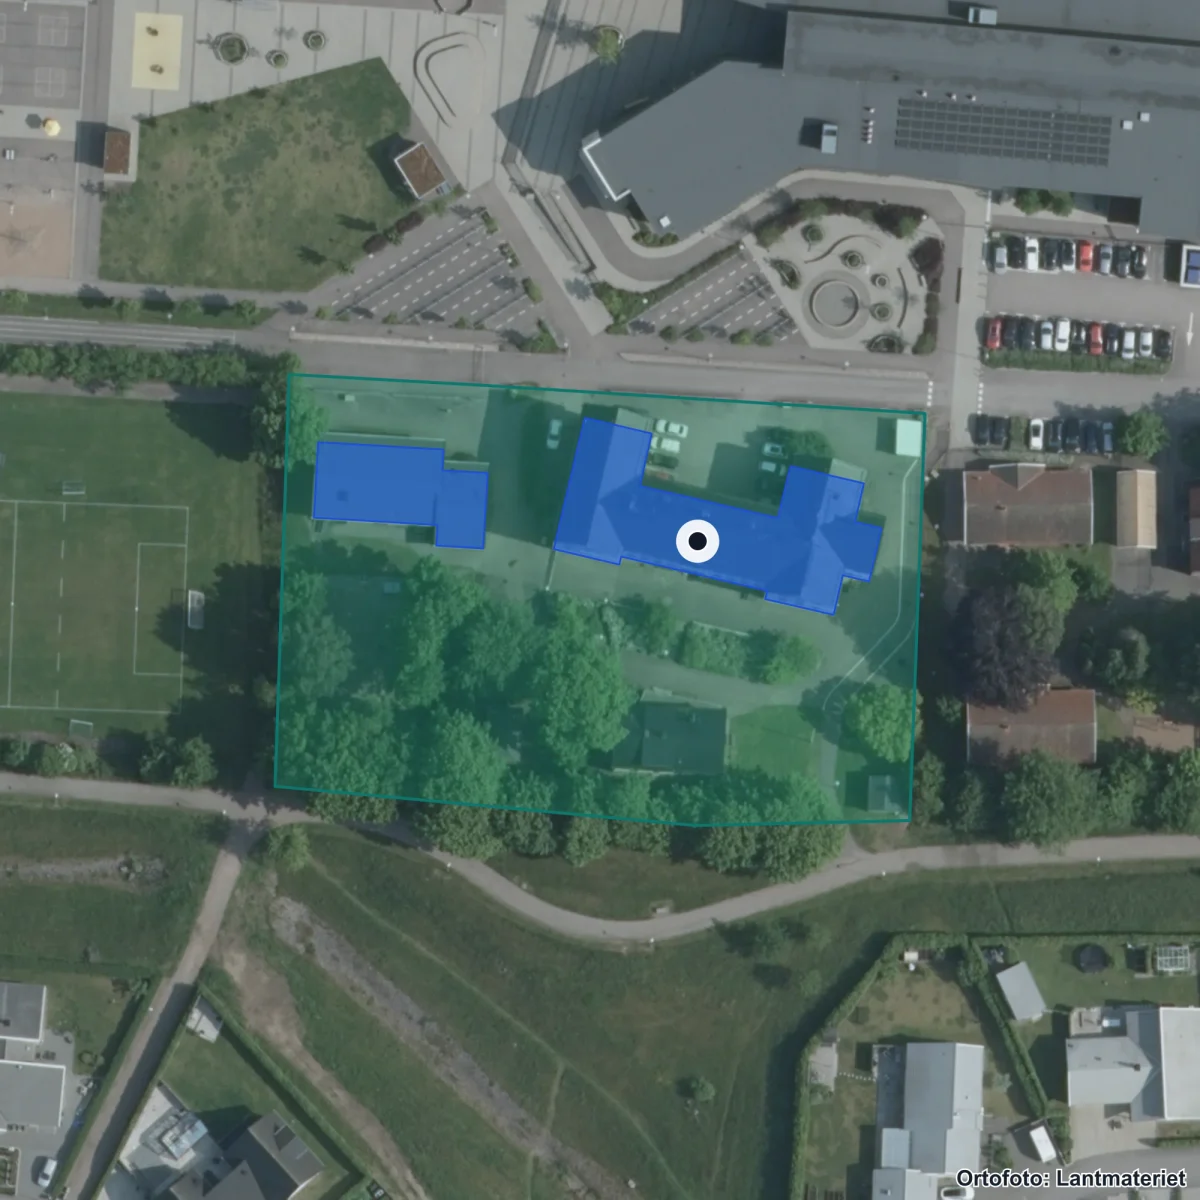
The school's property boundary and buildings from the Swedish Land Survey's property register. Updated 2026. Source: Lantmäteriet · CC BY 4.0
Entrances:1 Halmstad, Stenstorpsvägen 5, Halmstad
School performance
Staff
78%Qualified teachersMunicipality: 78% · Sweden: 72%
Staff
78%
Qualified teachers
78% of teachers hold a pedagogical degree — 6 percentage points above the national average.
- Qualified teachers Reliability: High reliability.
- 78%From 86% (2324) to 78% (2425)Municipality: 78% · Sweden: 72%
- Pupils per teacher Reliability: High reliability.
- 12.8From 16.3 (2324) to 12.8 (2425)Municipality: 12.2 · Sweden: 12.0
- Permanently employed Reliability: Moderate reliability.
- 87%
- Senior teachers (förstelärare) Reliability: Moderate reliability.
- —Data missing — the Swedish National Agency for Education has not published this value.
- Pupils per counsellor Reliability: Moderate reliability.
- 1,082.0
- Certified in their teaching subject Reliability: Moderate reliability.
- 74%
- Teachers (FTE) Reliability: Moderate reliability.
- 872.1
- Share of female teachers Reliability: Moderate reliability.
- 73%
- Teacher turnover Reliability: Moderate reliability.
- 12%
Moderate reliability — Mixed sources: certification + student/teacher ratio reported directly to Skolverket; other personnel fields from Skolverket's annual Personal report (1-2 year data lag).
School environment
Safety & Inspection
No active casesRecently inspected
Safety & Inspection
No active cases
Recently inspected
No open remarks from the Schools Inspectorate. Latest decision: Regelb. tillsyn Halmstad Stenstorpsskolan, 2011 (pdf, 322 kB).
- Open remarks Reliability: High reliability.
- 0
High reliability — Inspection register and Skolenkäten survey.
Source: Schools Inspectorate + Skolverket · Last updated: 5 Jul 2026
Resources
137,744 SEKCost per pupil (total)Sweden: 144,179 SEK
Resources
137,744 SEK
Cost per pupil (total)
Cost per pupil is 4% below the national average.
Limited history — Cost data updated annually by Kolada/SCB.
Who runs the school
Operator
HALMSTADS KOMMUNMunicipal operator166 other schools in the municipality.
Operator
HALMSTADS KOMMUN
Municipal operator

HALMSTADS KOMMUN is the operator. The municipality has 166 other schools.
- Operator Reliability: High reliability.
- HALMSTADS KOMMUN
- Operating form Reliability: High reliability.
- Municipal own operation
- Other schools in municipality Reliability: High reliability.
- 166
High reliability — Current data from Skolverket and Bolagsverket.
Source: Skolverket · Last updated: 5 Jul 2026
Contact and address
- Headmaster
- Sofia Kullgård
- Visiting address
- Stenstorpsvägen 5, 30230 Halmstad
- Postal address
- BOX 153, 30105 HALMSTAD
- Phone
- 035-132313
- School unit code
52347444
Source: Skolverket School Unit Register · Pipeline-fetched on 2026-07-05.
Everyday travelAreas that reach the school within 15 minutes.
Reachability from the school
15 min on foot
15 min by bike
School
Support and inclusion
Support and student health
This panel shows sourced support-resource data where available and marks the rest as missing or uncertain. These fields do not affect score or ranking.
Missing or uncertain support-resource fields
- MissingStudent health teamIs there sourced information about student health functions at the school?
- PartialSpecial educatorThe source does not split special educators and special needs teachers per school unit in this model.
- PartialSpecial needs teacherThe source does not split special educators and special needs teachers per school unit in this model.
- MissingSchool nurseIs there sourced information about school nurse resources?
- MissingPsychologistIs there sourced information about psychologist resources?
- MissingStudy and career guidanceIs there sourced information about study and career guidance?
- MissingLanguage supportIs there sourced information about language or mother-tongue support?
- MissingAdaptations and special supportIs there verified process information for adaptations and special support?
- MissingAccessibilityIs there sourced information about physical or pedagogical accessibility?
- MissingContact routeIs there a verified contact route for support questions?
Privacy rule: no individual pupil health, diagnosis, support decision or personal case data may be stored.
Nearest and similar schools
- Eketånga Montessoriskola8 km away· 220 pupils
- Fyllingeskolan F-37 km away· 160 pupils
- Linehedsskolan F-35 km away· 200 pupils
About Halmstad municipality
School-form averages across the municipality, with links to deep-dive sub-pages.
- Schools
- 166
- Avg. merit (yr 9)
- 231.3+3.6
- Certified teachers
- 80%+6 pp
- Pupils per teacher
- 12.3in line
Source: Skolverket (aggregated school statistics).
Similar schools
The 5 most-similar compulsory schools based on student count, geography, teacher certification and pupil composition.
School survey perspectives
Pupils, guardians and staff — same school, different answers
Survey results broken down by respondent group on a 0–10 scale. Groups can experience the same school very differently — notable gaps are highlighted below.
PupilsGuardians
Text summary of the chart:
- Pupils: Safety too few responses, Study environment too few responses, Stimulation too few responses, Support too few responses, Anti-bullying too few responses.
- Guardians: Safety too few responses, Study environment too few responses, Stimulation too few responses, Support too few responses.
Results with fewer than 5 responses are shown as “too few responses”.
Automatically flagged gaps
At least one respondent group has too few responses on the overlapping measures, so gaps cannot be calculated.
Staff results are not published per school by Skolinspektionen today, so the staff view appears only when available.
SALSA result
−16.0A statistical model that compares schools’ results with what is expected given the student composition.Read more in glossary →Performs below expectationsThe residual is actual minus expected merit value; positive means the school lifts pupils more than the model predicts.
How should SALSA be read?
SALSA is a statistical comparison metric, not a school rating. Small cohorts and individual year groups can create uncertain signals, so read it together with pupil counts, survey data and other sources.
Source: Skolverket/SALSA · See the full comparison table →
Pupils per year
Number of pupils per year group (total 265 pupils). Latest available year from Skolverket (SIRIS).
★ Watch Kärlekens skola
Get email when new statistics are published, merit value changes significantly or the School Inspectorate makes a new decision.
Want to dig deeper?
The Data view shows complete history, sources, methodology and CSV export.
In-depth metrics
Staff stability
Stable
Source: Kolada (municipality-aggregated certified teacher trend).
Throughput year 6 → year 9
67.9% → 66.4%
- 85 pupils yr 9
Source: Skolverket SIRIS + Skolverket Statistical Database.
School meals
Weekly menus and meal provider for this school's municipality.
No menu provider registered for this municipality yet.
Source: municipality's own meal portal — Skolkoll does not host menu content.
Inspections & decisions
The Schools Inspectorate has 2 decisions on record without critical findings.
Source: Skolinspektionen tillsynsregister (open data). Updated when new decisions are published. · See all decisions and review types in the data view → · Check current status at the Schools Inspectorate ↗
Explore further
More context about Kärlekens skola, its municipality, operator and similar schools.
Compulsory schools in HalmstadSee all compulsory schools in the municipality with results and comparisons.Schools in HalmstadOpen the municipality page with all schools, rankings, and local aggregates.Halmstads kommunSee all schools, municipalities, and core metrics for the same provider.Hallands länCompare municipalities and school patterns across the whole county.Merit value year 9Compare year-9 merit values across municipalities and school environments.Certification vs Merit valueSee how merit values and upper-secondary eligibility move together.Compare schoolsBuild a side-by-side comparison with the schools you care about.
Data coverage
What we do not know about Kärlekens skola
Open school data is not complete. Use this as a checklist for what to verify with the school, provider or municipality.
- MissingResults and score inputsSkolkoll score is not shown for this school type or lacks enough underlying data.
- MissingEligibility and goal attainmentGrades, eligibility and goal-attainment data may be missing, suppressed or available only for some grades and school types.
- UncertainResources, teachers and staffTeacher and resource metrics do not always show subject mix, vacancies, student-health workflows or everyday staffing.
- PartialSupport resources and student healthSome support-resource fields have sourced statistics, but several parts are still missing or reported only in aggregate.
- MissingSafety and study environmentWe lack current or displayable survey data about safety and study environment for this school.
- UncertainAdmissions, placement and important datesMunicipal placement rules, queues and important dates require a local source and should be checked with the municipality or school.
- MissingVisits, facilities and everyday environmentWe lack sourced open-house information for this school. Facilities, accessibility and everyday environment are often not open comparable data.
See Data view for full sources and fetch dates per source.