Hälsingegymnasiet in Bollnäs
Headmaster: Roger Wallgren
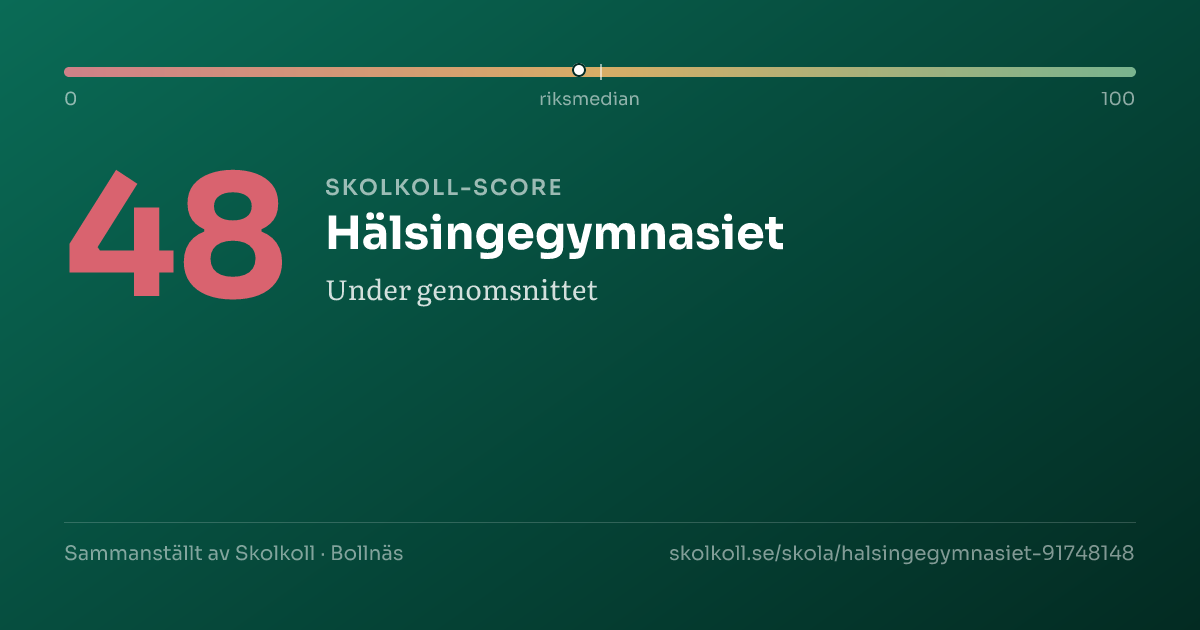
48
Skolkoll Score 48 out of 100. The scale goes from 0 (lowest) to 100 (highest). 50 is the average. Better than 58% of Sweden’s upper secondary schools.top 42%Shows where a school sits within a comparison group. Percentile 80 means the school ranks above roughly 80 percent of that group.Compared to all upper-secondary schools nationally
A composite of five open data sources — a starting point, not a grade.
Data coverageHigh4/5
Why this score?
Skolkoll score is Skolkoll's composite indicator based on available data sources. It is not an official quality measure and should be read together with the underlying data.
4 of 5 score dimensions have school-specific data.
When school-specific data is missing for a dimension, the neutral value 50 is used. That does not automatically lower the school, but it makes the score less informative.

Hälsingegymnasiet is a medium-sized independent upper secondary school with 150 pupils.
Hälsingegymnasiet is a medium-sized independent upper secondary school with 150 pupils. The share of qualified teachers (68%) is below the national average of 78%.
- 150PupilsMunicipality: 910High reliability
- 68%Qualified teachersMunicipality: 62% · Sweden: 78%High reliability
- 13.9Graduation gradeMunicipality: 13.7 · Sweden: 13.8Moderate reliability
- 13.7Pupils per teacherMunicipality: 9.0 · Sweden: 12.1High reliability
- 141,589 SEKCost per pupil (municipal avg.)Sweden: 144,179 SEKLimited history
See how schools in Bollnäs rank →
The most important facts in 3 points
- Upper secondary school in Bollnäs with 150 pupils.
- The latest record (2021) is a review or decision without risk classification.
- Applying? Go to the school's application link on this page.
Skolkoll interpretation
Hälsingegymnasiet is compared here with 5 other schools with the same school form in Bollnäs municipality; it has 150 pupils versus the municipal average of 182.
The average graduation grade is 13.9, 0.2 points above the municipal average and 0.1 points above the national average.
Qualified teachers: 68%, 6 percentage points above the municipal average and 10 percentage points below the national average.
Pupils per teacher is 13.7, 4.7 higher than the municipal average.
Apply for a place? Use Bollnäs e-service for upper-secondary application (opens in a new window).
School programmes
- Upper secondary school
Things to look into
Worth looking into. These indicators are an attention aid, not a quality grade or risk score.
- 68% qualified teachers — more than 10 percentage points below the national average (78%).
School profile
The school's strengths compared with all upper-secondary schools nationally.
- Grade pointsP58
- Certified teachersP23
- Pupil-teacher ratioP34
- Eligibility (higher education)P55
- Graduated within 3 yearsP52
Source: Skolverket, Swedish Schools Inspectorate.
Aerial view of the school
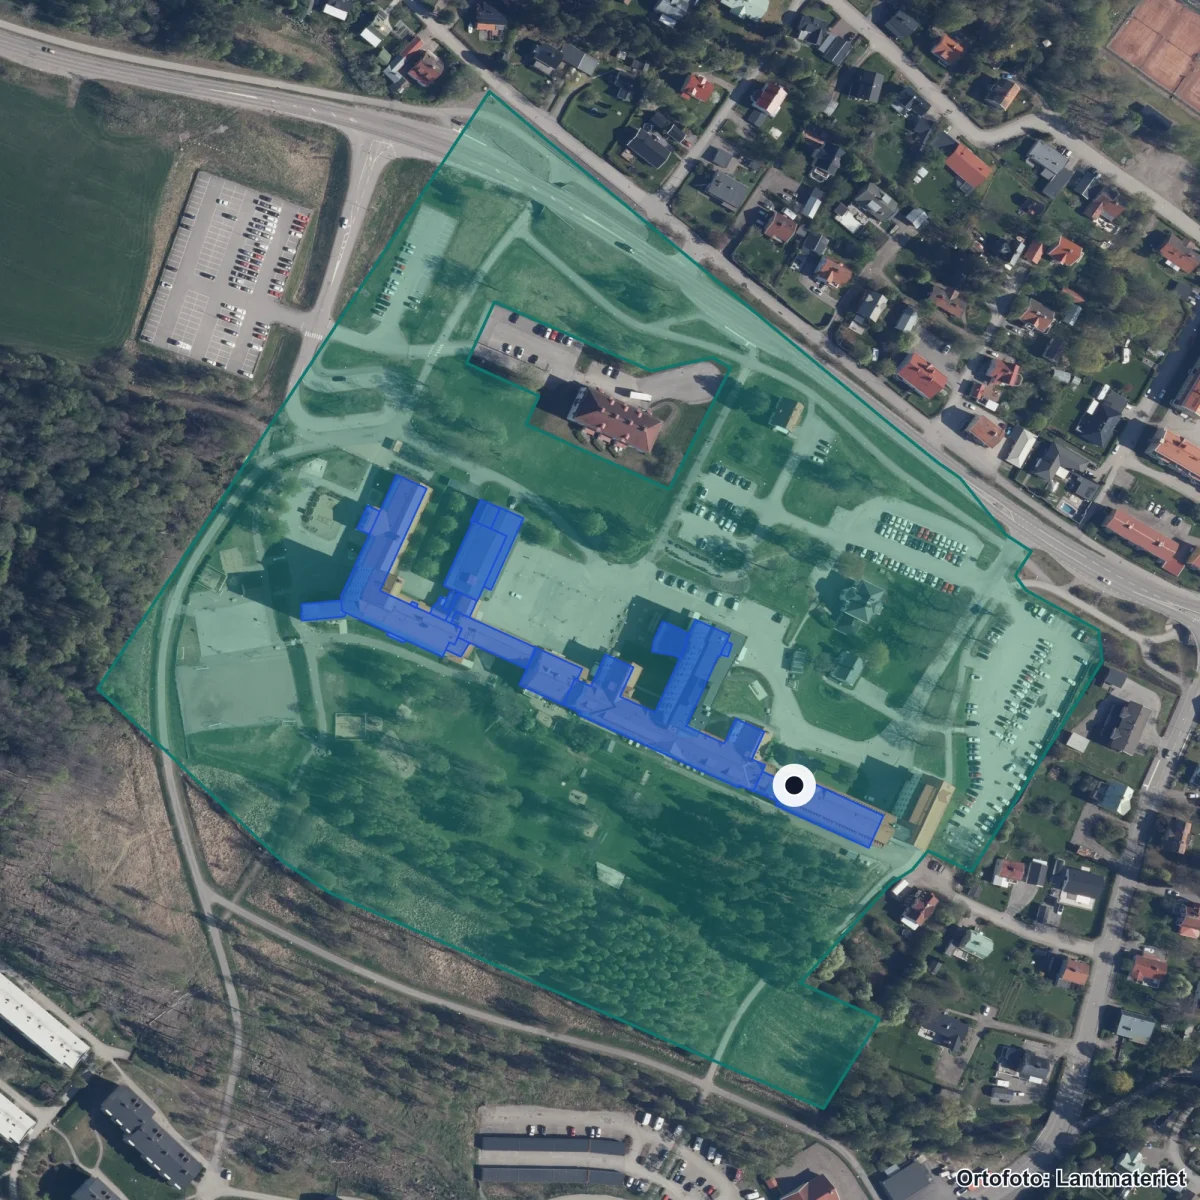
The school's property boundary and buildings from the Swedish Land Survey's property register. Updated 2026. Source: Lantmäteriet · CC BY 4.0
Entrances:1 Bollnäs, Nyhedsbacken 3, Bollnäs
School performance
Results
13.9Avg. graduation gradeSweden: 13.8
Results
13.9
Avg. graduation grade
Average graduation grade is 0.1 points above the national average.
Admission scores per programme
| Programme | Avg. | Sweden | Difference |
|---|---|---|---|
| Ekonomiprogrammet | 207.5 | — | |
| Naturvetenskapsprogrammet | 127.5 | — | |
| Teknikprogrammet | 197.5 | — |
Lowest admitted merit score from latest admission round. Smaller programmes (under 20 places) have larger year-to-year variation.
After graduation (3 years)
| Outcome | Share |
|---|---|
| Studying in higher education | 49.5% |
| Established in the labor market (vocational programmes) | 31.6% |
Source: Skolverket Statistikdatabasen (per school unit, 3 years after graduation). Rows are independent outcome metrics and do not sum to 100%. One-year follow-up and a university-vs-other-studies split are not published in open data per school.
Moderate reliability — Mixed sources: results reported directly by the school operator; post-graduation outcomes (3 years) from Skolverket Statistikdatabasen.
Staff
68%Qualified teachersMunicipality: 62% · Sweden: 78%
Staff
68%
Qualified teachers
68% of teachers hold a pedagogical degree — 11 percentage points below the national average.
High reliability — Reported directly by the school operator.
School environment
Safety & Inspection
No active casesRecently inspected 2021Safety index: 78 / 100
Safety & Inspection
No active cases
Recently inspected 2021
No open remarks from the Schools Inspectorate. Latest decision: Riktad tillsyn Skolbeslut Gymnasieskolan Bollnäs Hälsingegymnasiet, 2020 (pdf, 247 kB).
- Latest inspection decision Reliability: High reliability.
- 2021-02-04 — Riktad tillsyn Skolbeslut Gymnasieskolan Bollnäs Hälsingegymnasiet, 2020 (pdf, 247 kB)
- Open remarks Reliability: High reliability.
- 0
- Safety index Reliability: High reliability.
- 78 / 100Safety: 89% · Study peace: 70% · Anti-bullying: 70%
Safety index
78/ 100(High data coverage)
- Safety89%(national 84)
- Study peace70%(national 64)
- Anti-bullying70%(national 63)
School Survey — all perspectives
| Dimension | Pupils (gy 2) | Guardian | Staff |
|---|---|---|---|
| Safety | 8.9 / 10 | — | — |
| Study environment | 7.0 / 10 | — | — |
| Anti-bullying | 7.0 / 10 | — | — |
| Stimulation | 6.2 / 10 | — | — |
| Support | 7.0 / 10 | — | — |
Scale 0–10 (rescaled from Skolverket's 0–100). Guardian and staff perspectives are often not in open data.
High reliability — Inspection register and Skolenkäten survey.
Source: Schools Inspectorate + Skolverket · Last updated: 5 Jul 2026
Resources
141,589 SEKCost per pupil (total)Sweden: 144,179 SEK
Resources
141,589 SEK
Cost per pupil (total)
Cost per pupil is 2% below the national average.
Limited history — Cost data updated annually by Kolada/SCB.
Who runs the school
Operator
Hälsingegymnasiet ABIndependent operator49 other schools in the municipality.
Operator
Hälsingegymnasiet AB
Independent operator
Hälsingegymnasiet AB operates this school independently.
- Operator Reliability: High reliability.
- Hälsingegymnasiet AB
- Operating form Reliability: High reliability.
- Independent
- Other schools in municipality Reliability: High reliability.
- 49
High reliability — Current data from Skolverket and Bolagsverket.
Source: Skolverket · Last updated: 5 Jul 2026
Next step: Apply for a place
Apply through Bollnäs e-service for upper-secondary application.
Contact and address
- Headmaster
- Roger Wallgren
- Visiting address
- Nyhedsbacken 3, 82131 Bollnäs
- Postal address
- Nyhedsbacken 3, 82131 BOLLNÄS
- Phone
- 0278-15000
- Website
- www.halsingegymnasiet.se/
- School unit code
91748148
Source: Skolverket School Unit Register · Pipeline-fetched on 2026-07-05.
Everyday travelAreas that reach the school within 15 minutes.
Reachability from the school
15 min on foot
15 min by bike
School
Daily-life profile
Everyday life at the school
Everyday facts are shown with a source where available. Fields not yet collected are listed together and do not affect score or ranking.
Not collected yet: School day times, After-school care, Language choices, Food and dining, Facilities and outdoor environment, Homework and study support. Suggest an addition →
Nearest and similar schools
- Torsbergsgymnasiet RO51 km away· 300 pupils
- Voxgym 230 km away· 160 pupils
- Naturlära i Hälsingland27 km away· 30 pupils

About Bollnäs municipality
School-form averages across the municipality, with links to deep-dive sub-pages.
- Schools
- 50
- Avg. merit (yr 9)
- 208.9−18.8
- Certified teachers
- 66%−8 pp
- Pupils per teacher
- 11.0−1.0
Source: Skolverket (aggregated school statistics).
Similar schools
The 5 most-similar upper secondary schools based on student count, geography, teacher certification and pupil composition.
★ Watch Hälsingegymnasiet
Get email when new statistics are published, merit value changes significantly or the School Inspectorate makes a new decision.
Want to dig deeper?
The Data view shows complete history, sources, methodology and CSV export.
In-depth metrics
Staff stability
Improving
Source: Kolada (municipality-aggregated certified teacher trend).
Safety and study environment (SkolenkätenThe Schools Inspectorate’s survey sent to pupils, parents, and staff about safety, classroom order, and teaching.Read more in glossary →)
The school survey shows pupil experience where responses are available. Read values together with year, response coverage and unknowns.
Coverage: 1 displayed year group · year 2026.
Strongest (Upper-sec. year 2)
- Safety: 89 (national 84)
- Study environment: 70 (national 64)
Weakest (Upper-sec. year 2)
- Stimulation: 62 (national 61)
- Support: 70 (national 67)
Support-needs policy · School-choice guide
Source: Skolinspektionen Skolenkäten 2026. Updated annually. · See all years and dimensions in the data view →
School meals
Weekly menus and meal provider for this school's municipality.
No menu provider registered for this municipality yet.
Source: municipality's own meal portal — Skolkoll does not host menu content.
Inspections & decisions
The Schools Inspectorate has 4 decisions on record without critical findings. Most recent: Feb 2021.
Source: Skolinspektionen tillsynsregister (open data). Updated when new decisions are published. · See all decisions and review types in the data view → · Check current status at the Schools Inspectorate ↗
Admissions pressure & cutoffs
Applicants per place and latest admission cutoff per programme (2025).
High demand reflects popularity, which depends on location and reputation as well as quality. Cutoffs measure entry difficulty, not school quality.
- Ekonomiprogrammet207.5points
- Naturvetenskapsprogrammet127.5points
- Teknikprogrammet197.5points
Source: Gymnasieantagningen (regional admission databases). Latest year: 2025.
Graduation rate within 3 years
85%graduate within 3 years
Not graduated15%
vs national avg.3 percentage points above national average (82%)
vs Bollnäs (GY avg.)4 percentage points below Bollnäs (GY graduation average) (89%)
Source: Skolverket (graduation rate within 3 years). Updated annually.
After upper secondary
Source: Skolverket (higher-education eligibility).
Explore further
More context about Hälsingegymnasiet, its municipality, operator and similar schools.
Upper secondary schools in BollnäsSee all upper secondary schools in the municipality with graduation rates.Schools in BollnäsOpen the municipality page with all schools, rankings, and local aggregates.Hälsingegymnasiet ABSee all schools, municipalities, and core metrics for the same provider.Gävleborgs länCompare municipalities and school patterns across the whole county.Upper secondary schoolsGet the national upper-secondary overview of school size and outcomes.Cost vs ResultsCompare outcomes and resource levels across municipalities and school markets.Compare schoolsBuild a side-by-side comparison with the schools you care about.
Data coverage
What we do not know about Hälsingegymnasiet
Open school data is not complete. Use this as a checklist for what to verify with the school, provider or municipality.
- HighResults and score inputsHigh data coverage: 4 of 5 score dimensions have school-specific data. When school-specific data is missing for a dimension, the neutral value 50 is used. That does not automatically lower the school, but it makes the score less informative.
- HighEligibility and goal attainmentGrades, eligibility and goal-attainment data may be missing, suppressed or available only for some grades and school types.
- PartialResources, teachers and staffTeacher and resource metrics do not always show subject mix, vacancies, student-health workflows or everyday staffing.
- MissingSupport resources and student healthWe do not yet have a verified national data source for special education, student health, adaptations, language support or contact routes per school.
- PartialSafety and study environmentThe school survey is shown where available, but not every grade and perspective is always covered.
- PartialAdmissions, placement and important datesAdmission data is available for upper-secondary programmes where sources publish it, but it is historical and not a forecast.
- MissingVisits, facilities and everyday environmentWe lack sourced open-house information for this school. Facilities, accessibility and everyday environment are often not open comparable data.
For the school: get your Skolkoll badge
Work at this school? Embed an image showing the school's Skolkoll score that links to the full profile. The image is served from Skolkoll's image host and updates when we publish a new badge for the school.
See Data view for full sources and fetch dates per source.