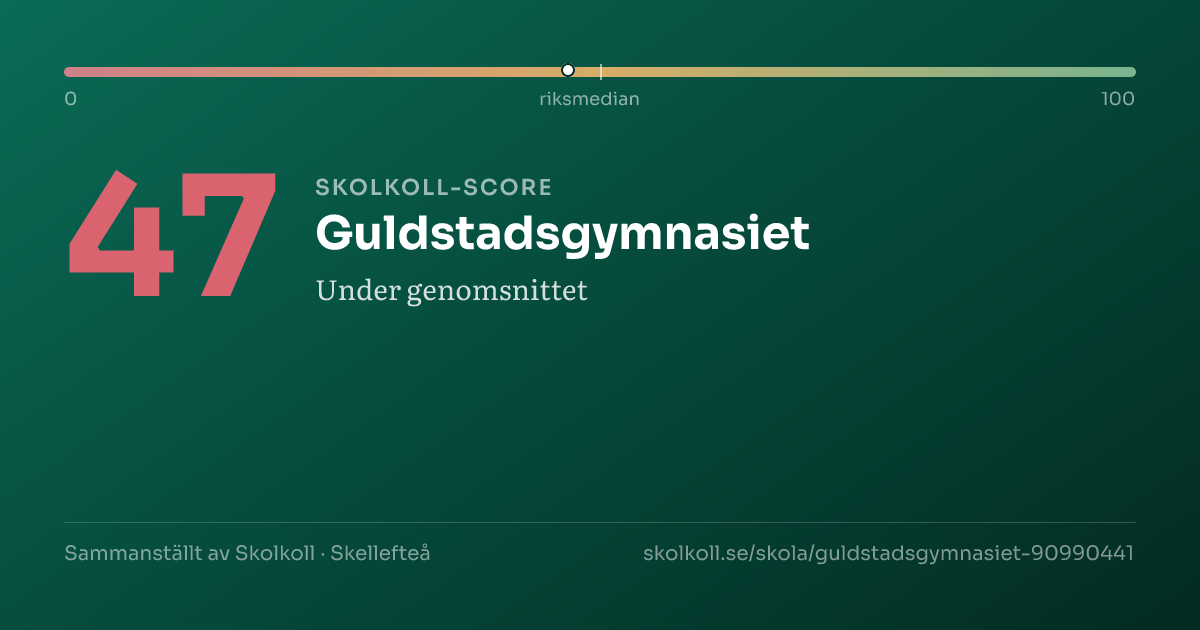
47
Skolkoll Score 47 out of 100. The scale goes from 0 (lowest) to 100 (highest). 50 is the average. Better than 50% of Sweden’s upper secondary schools.around the national midpointShows where a school sits within a comparison group. Percentile 80 means the school ranks above roughly 80 percent of that group.Compared to all upper-secondary schools nationally
A composite of five open data sources — a starting point, not a grade.
Data coverageHigh4/5
Why this score?
Skolkoll score is Skolkoll's composite indicator based on available data sources. It is not an official quality measure and should be read together with the underlying data.
4 of 5 score dimensions have school-specific data.
When school-specific data is missing for a dimension, the neutral value 50 is used. That does not automatically lower the school, but it makes the score less informative.
Guldstadsgymnasiet is a medium-sized group-operated upper secondary school with 150 pupils.
Guldstadsgymnasiet is a medium-sized group-operated upper secondary school with 150 pupils. The share of qualified teachers (75%) is below the national average of 78%.
- 150PupilsMunicipality: 2,770High reliability
- 75%Qualified teachersMunicipality: 75% · Sweden: 78%High reliability
- 13.6Graduation gradeMunicipality: 13.0 · Sweden: 13.8Moderate reliability
- 14.4Pupils per teacherMunicipality: 9.2 · Sweden: 12.1High reliability
- 151,467 SEKCost per pupil (municipal avg.)Sweden: 144,179 SEKLimited history
See how schools in Skellefteå rank →
The most important facts in 3 points
- Upper secondary school in Skellefteå with 150 pupils.
- The latest inspection (2018) shows an injunction or fine from the Schools Inspectorate.
- Applying? Go to the school's application link on this page.
Skolkoll interpretation
Guldstadsgymnasiet is compared here with 9 other schools with the same school form in Skellefteå municipality; it has 150 pupils versus the municipal average of 308.
The average graduation grade is 13.6, 0.6 points above the municipal average and 0.2 points below the national average.
Qualified teachers: 75%, in line with the municipal average and 3 percentage points below the national average.
Pupils per teacher is 14.4, 5.2 higher than the municipal average.
Apply for a place? Use Skellefteå e-service for upper-secondary application (opens in a new window).
Eligible for higher education and Graduation rate need extra caution
This applies only to the values listed here.
This value is missing in full or in part.
This affects
- Eligible for higher education
- Graduation rate
- This result metric can be affected by privacy suppression, small cohorts, and changes in pupil composition between years.
Other values here do not have this specific note.
School programmes
- Upper secondary school
Things to look into
No clear flag.
No clear attention flags from key-figure deviations or the School Inspectorate's public register. Detailed inspection history is shown in the "Safety & Inspection" card below.
School profile
The school's strengths compared with all upper-secondary schools nationally.
- Grade pointsP50
- Certified teachersP34
- Pupil-teacher ratioP29
Source: Skolverket, Swedish Schools Inspectorate.
Aerial view of the school
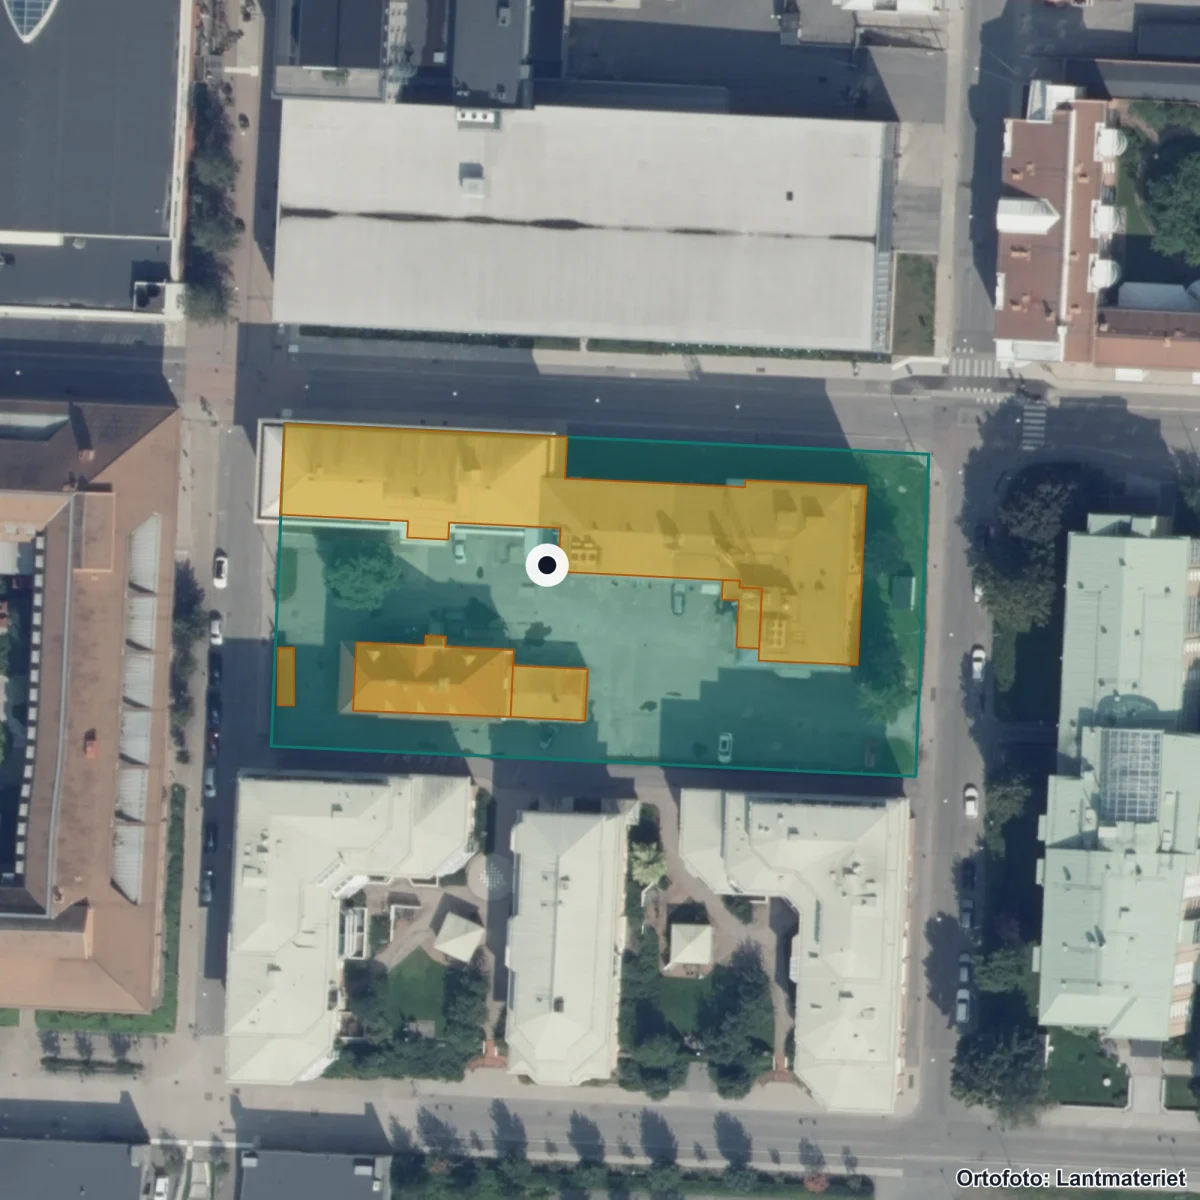
Aerial view of the school's surroundings. The property is marked from the register; building use has not been verified. Updated 2026. Source: Lantmäteriet · CC BY 4.0
Entrances:1 Skellefteå, Storgatan 50, Skellefteå
School performance
Results
13.6Avg. graduation gradeSweden: 13.8
Results
13.6
Avg. graduation grade
Average graduation grade is 0.2 points below the national average.
Admission scores per programme
| Programme | Avg. | Sweden | Difference |
|---|---|---|---|
| Barn- och fritidsprogrammet | 120 | — | |
| El- och energiprogrammet | 107.5 | — | |
| Ekonomiprogrammet | 167.5 | — | |
| Estetiska programmet | 135 | — | |
| Frisör- och stylistprogrammet | 187.5 | — | |
| Samhällsvetenskapsprogrammet | 217.5 | — |
Lowest admitted merit score from latest admission round. Smaller programmes (under 20 places) have larger year-to-year variation.
After graduation (3 years)
| Outcome | Share |
|---|---|
| Studying in higher education | 31.3% |
| Established in the labor market (vocational programmes) | 49.4% |
Source: Skolverket Statistikdatabasen (per school unit, 3 years after graduation). Rows are independent outcome metrics and do not sum to 100%. One-year follow-up and a university-vs-other-studies split are not published in open data per school.
Moderate reliability — Mixed sources: results reported directly by the school operator; post-graduation outcomes (3 years) from Skolverket Statistikdatabasen.
Staff
75%Qualified teachersMunicipality: 75% · Sweden: 78%
Staff
75%
Qualified teachers
75% of teachers hold a pedagogical degree — 4 percentage points below the national average.
High reliability — Reported directly by the school operator.
School environment
Safety & Inspection
1 openRecently inspected 2018Safety index: 68 / 100
Safety & Inspection
1 open
Recently inspected 2018
1 open remark(s) from the Schools Inspectorate.
- Latest inspection decision Reliability: High reliability.
- 2018-03-16 — Regelb. tillsyn Skolbeslut Skellefteå Guldstadsgymnasiet i Skellefteå, 2018 (pdf, 249 kB)
- Open remarks Reliability: High reliability.
- 1
- Safety index Reliability: High reliability.
- 68 / 100Safety: 79% · Study peace: 58% · Anti-bullying: 63%
Safety index
68/ 100(High data coverage)
- Safety79%(national 84)
- Study peace58%(national 64)
- Anti-bullying63%(national 63)
School Survey — all perspectives
| Dimension | Pupils (gy 2) | Guardian | Staff |
|---|---|---|---|
| Safety | 7.9 / 10 | — | — |
| Study environment | 5.8 / 10 | — | — |
| Anti-bullying | 6.3 / 10 | — | — |
| Stimulation | 5.9 / 10 | — | — |
| Support | 6.5 / 10 | — | — |
Scale 0–10 (rescaled from Skolverket's 0–100). Guardian and staff perspectives are often not in open data.
High reliability — Inspection register and Skolenkäten survey.
Source: Schools Inspectorate + Skolverket · Last updated: 5 Jul 2026
Resources
151,467 SEKCost per pupil (total)Sweden: 144,179 SEK
Resources
151,467 SEK
Cost per pupil (total)
Cost per pupil is 5% above the national average.
Limited history — Cost data updated annually by Kolada/SCB.
Who runs the school
Operator
Reprendo ABGroup operator143 other schools in the municipality.
Operator
Reprendo AB
Group operator
Reprendo AB operates this school as part of a larger concern.
- Operator Reliability: High reliability.
- Reprendo AB
- Operating form Reliability: High reliability.
- Group-operated
- Concern (parent organisation) Reliability: High reliability.
- Reprendo AB
- Concern org. number Reliability: High reliability.
- 5568896194
- Other schools in municipality Reliability: High reliability.
- 143
High reliability — Current data from Skolverket and Bolagsverket.
Source: Skolverket · Last updated: 5 Jul 2026
Next step: Apply for a place
Apply through Skellefteå e-service for upper-secondary application.
Contact and address
- Headmaster
- Maria Holmstén
- Visiting address
- Storgatan 50, 93130 Skellefteå
- Postal address
- Kaserngatan 13, 83132 ÖSTERSUND
- Phone
- 0910-215121
- Website
- www.guldstadsgymnasiet.se/
- School unit code
90990441
Source: Skolverket School Unit Register · Pipeline-fetched on 2026-07-05.
Everyday travelAreas that reach the school within 15 minutes.
Reachability from the school
15 min on foot
15 min by bike
School
Daily-life profile
Everyday life at the school
Everyday facts are shown with a source where available. Fields not yet collected are listed together and do not affect score or ranking.
Not collected yet: School day times, After-school care, Language choices, Food and dining, Facilities and outdoor environment, Homework and study support. Suggest an addition →
Nearest and similar schools
- Yrkesgymnasiet Skellefteå2 km away· 100 pupils
- Praktiska Gymnasiet Skellefteå1 km away· 170 pupils
- Anderstorpsgymnasiet Hammarängen2 km away· 70 pupils

About Skellefteå municipality
School-form averages across the municipality, with links to deep-dive sub-pages.
- Schools
- 144
- Avg. merit (yr 9)
- 222.7−5.0
- Certified teachers
- 74%in line
- Pupils per teacher
- 9.4−2.6
Source: Skolverket (aggregated school statistics).
Similar schools
The 5 most-similar upper secondary schools based on student count, geography, teacher certification and pupil composition.
Yrkesgymnasiet Skellefteå
Skellefteå
Merit: 12.7Cert: —100 pupils
Praktiska Gymnasiet Skellefteå
Skellefteå
Merit: 10.2Cert: 69%170 pupils
Anderstorpsgymnasiet Hammarängen
Skellefteå
Merit: 13.0Cert: —70 pupils
Naturbruksgymnasiet i Burträsk
Skellefteå
Merit: —Cert: 75%90 pupils
Baldergymnasiet introduktionsprogrammet
Skellefteå
Merit: —Cert: 57%100 pupils
★ Watch Guldstadsgymnasiet
Get email when new statistics are published, merit value changes significantly or the School Inspectorate makes a new decision.
Want to dig deeper?
The Data view shows complete history, sources, methodology and CSV export.
In-depth metrics
Staff stability
Declining
Source: Kolada (municipality-aggregated certified teacher trend).
Safety and study environment (SkolenkätenThe Schools Inspectorate’s survey sent to pupils, parents, and staff about safety, classroom order, and teaching.Read more in glossary →)
The school survey shows pupil experience where responses are available. Read values together with year, response coverage and unknowns.
Coverage: 1 displayed year group · year 2026.
Strongest (Upper-sec. year 2)
- Safety: 79 (national 84)
- Support: 65 (national 67)
Weakest (Upper-sec. year 2)
- Study environment: 58 (national 64)
- Stimulation: 59 (national 61)
Support-needs policy · School-choice guide
Source: Skolinspektionen Skolenkäten 2026. Updated annually. · See all years and dimensions in the data view →
School meals
Weekly menus and meal provider for this school's municipality.
No menu provider registered for this municipality yet.
Source: municipality's own meal portal — Skolkoll does not host menu content.
Inspections & decisions
Source: Skolinspektionen tillsynsregister (open data). Updated when new decisions are published. · See all decisions and review types in the data view → · Check current status at the Schools Inspectorate ↗
Admissions pressure & cutoffs
Applicants per place and latest admission cutoff per programme (2026).
High demand reflects popularity, which depends on location and reputation as well as quality. Cutoffs measure entry difficulty, not school quality.
- Barn- och fritidsprogrammet120points
- El- och energiprogrammet107.5points
- Ekonomiprogrammet167.5points
- Estetiska programmet135points
- Frisör- och stylistprogrammet187.5points
- Hantverksprogrammet
- Introduktionsprogram IM Anpassad
- Introduktionsprogram IM
- Introduktionsprogram IM Yrkesintro
- Samhällsvetenskapsprogrammet217.5points
Source: Gymnasieantagningen (regional admission databases). Latest year: 2026.
Explore further
More context about Guldstadsgymnasiet, its municipality, operator and similar schools.
Upper secondary schools in SkellefteåSee all upper secondary schools in the municipality with graduation rates.Schools in SkellefteåOpen the municipality page with all schools, rankings, and local aggregates.Honesta Skolutveckling ABSee all schools, municipalities, and core metrics for the same provider.Reprendo ABOpen the full school-group page with providers, municipalities, and group totals.Västerbottens länCompare municipalities and school patterns across the whole county.Upper secondary schoolsGet the national upper-secondary overview of school size and outcomes.Cost vs ResultsCompare outcomes and resource levels across municipalities and school markets.Compare schoolsBuild a side-by-side comparison with the schools you care about.
Data coverage
What we do not know about Guldstadsgymnasiet
Open school data is not complete. Use this as a checklist for what to verify with the school, provider or municipality.
- HighResults and score inputsHigh data coverage: 4 of 5 score dimensions have school-specific data. When school-specific data is missing for a dimension, the neutral value 50 is used. That does not automatically lower the school, but it makes the score less informative.
- HighEligibility and goal attainmentGrades, eligibility and goal-attainment data may be missing, suppressed or available only for some grades and school types.
- PartialResources, teachers and staffTeacher and resource metrics do not always show subject mix, vacancies, student-health workflows or everyday staffing.
- MissingSupport resources and student healthWe do not yet have a verified national data source for special education, student health, adaptations, language support or contact routes per school.
- PartialSafety and study environmentThe school survey is shown where available, but not every grade and perspective is always covered.
- PartialAdmissions, placement and important datesAdmission data is available for upper-secondary programmes where sources publish it, but it is historical and not a forecast.
- MissingVisits, facilities and everyday environmentWe lack sourced open-house information for this school. Facilities, accessibility and everyday environment are often not open comparable data.
For the school: get your Skolkoll badge
Work at this school? Embed an image showing the school's Skolkoll score that links to the full profile. The image is served from Skolkoll's image host and updates when we publish a new badge for the school.
See Data view for full sources and fetch dates per source.