Backa Friskola in Karlstad
Headmaster: Nova Wegerif
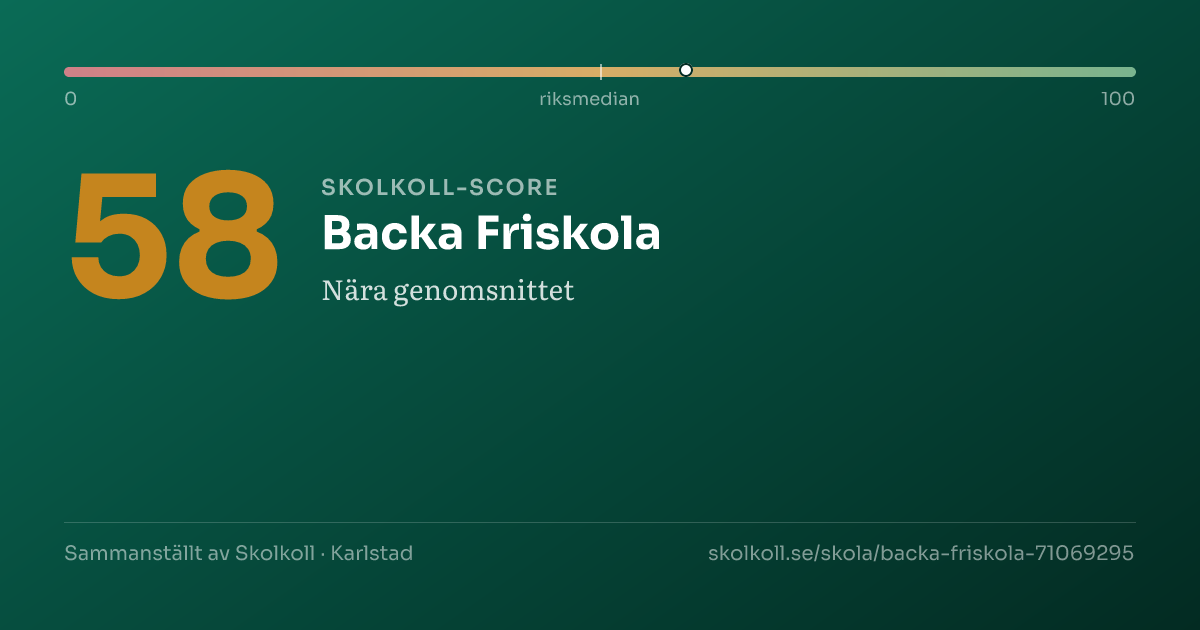
58
Skolkoll Score 58 out of 100. The scale goes from 0 (lowest) to 100 (highest). 50 is the average. Better than 50% of Sweden’s compulsory schools.around the national midpointShows where a school sits within a comparison group. Percentile 80 means the school ranks above roughly 80 percent of that group.Compared to all compulsory schools nationally
A composite of five open data sources — a starting point, not a grade.
Data coverageMedium3/5
Why this score?
Skolkoll score is Skolkoll's composite indicator based on available data sources. It is not an official quality measure and should be read together with the underlying data.
3 of 5 score dimensions have school-specific data.
When school-specific data is missing for a dimension, the neutral value 50 is used. That does not automatically lower the school, but it makes the score less informative.
Backa Friskola is a small independent compulsory school with 60 pupils.
Backa Friskola is a small independent compulsory school with 60 pupils. The share of qualified teachers (75%) is above the national average of 72%.
- 60PupilsMunicipality: 7,450High reliability
- 75%Qualified teachersMunicipality: 79% · Sweden: 72%High reliability
- 7.6Pupils per teacherMunicipality: 12.3 · Sweden: 12.0High reliability
- 141,174 SEKCost per pupil (municipal avg.)Sweden: 144,179 SEKLimited history
See how schools in Karlstad rank →
The most important facts in 3 points
- Adapted compulsory school in Karlstad with 60 pupils.
- The latest record is a review or decision without risk classification.
- Applying? Go to the school's application link on this page.
Skolkoll interpretation
Backa Friskola is compared here with 40 other schools with the same school form in Karlstad municipality; it has 60 pupils versus the municipal average of 219.
Qualified teachers: 75%, 4 percentage points below the municipal average and 3 percentage points above the national average.
Pupils per teacher is 7.6, 4.7 lower than the municipal average.
Apply for a place? Use Karlstad e-service for school choice (opens in a new window).
4 values need extra caution
This applies only to the values listed here.
This value is missing in full or in part.
This affects
- Eligible for vocational programmes
- Group name
- Merit score year 9
- SALSA score
- This result metric can be affected by privacy suppression, small cohorts, and changes in pupil composition between years.
- Annual reports are not real-time data, so group links may lag behind reorganisations or recent ownership changes. Manual overrides are used only as exceptions.
- SALSA is model-based and becomes less stable for small pupil groups or schools with rapidly changing pupil composition.
Other values here do not have this specific note.
School programmes
- Compulsory school
Things to look into
No clear flag.
No clear attention flags from key-figure deviations or the School Inspectorate's public register. Detailed inspection history is shown in the "Safety & Inspection" card below.
School profile
The school's strengths compared with all primary schools nationally.
- Certified teachersP52
- Pupil-teacher ratioP95
Source: Skolverket, Swedish Schools Inspectorate.
Aerial view of the school
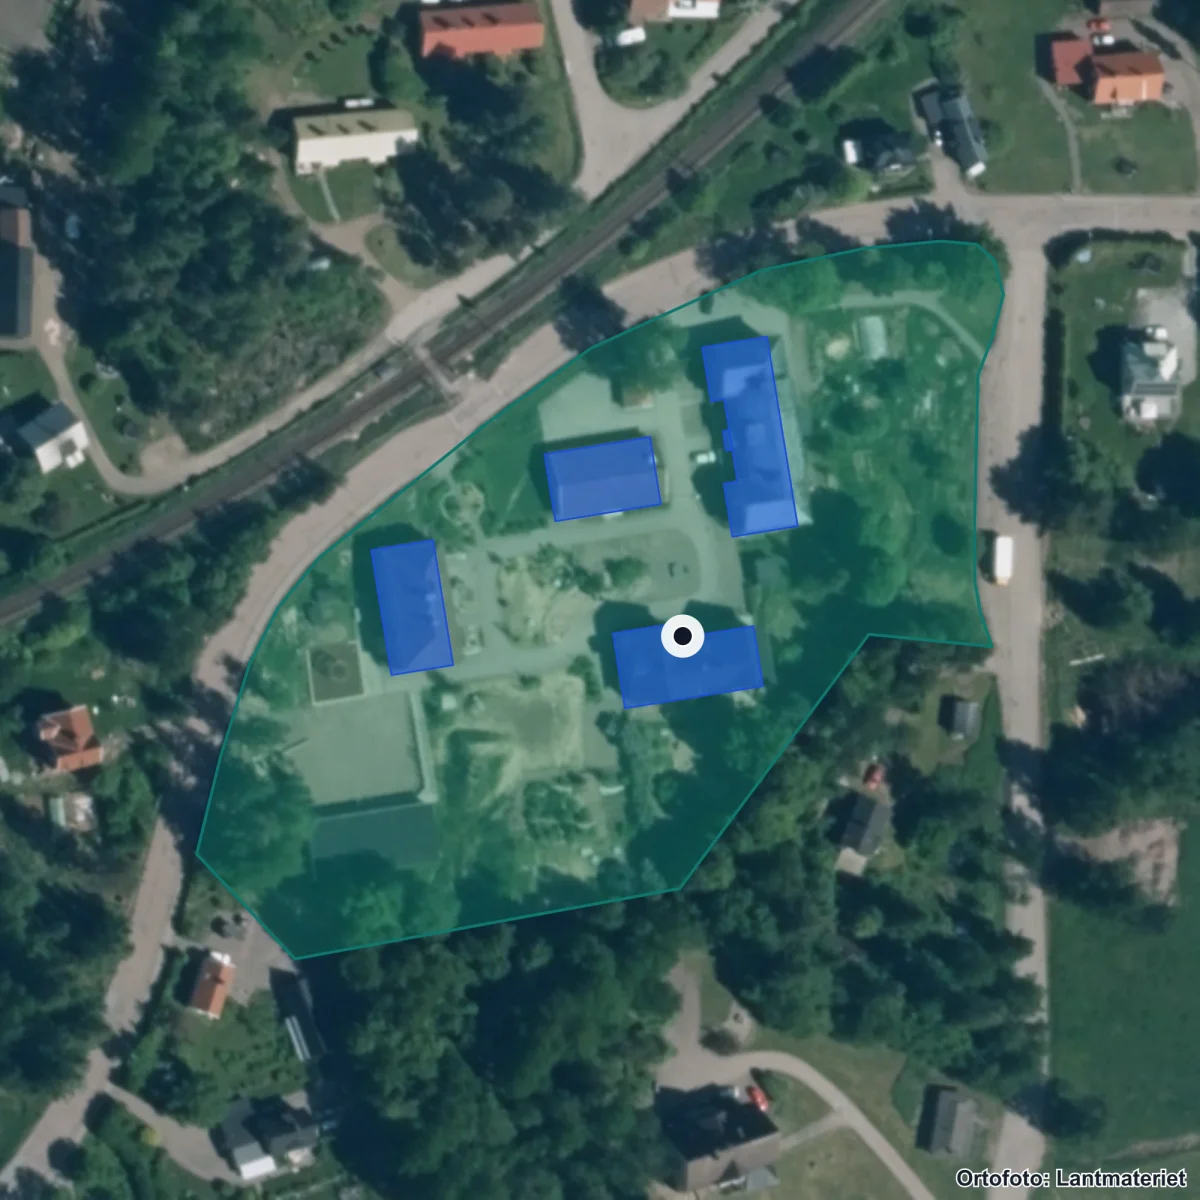
The school's property boundary and buildings from the Swedish Land Survey's property register. Updated 2026. Source: Lantmäteriet · CC BY 4.0
Entrances:1 Karlstad, Skolgatan 7, Molkom
School performance
Staff
75%Qualified teachersMunicipality: 79% · Sweden: 72%
Staff
75%
Qualified teachers
75% of teachers hold a pedagogical degree — 3 percentage points above the national average.
- Qualified teachers Reliability: High reliability.
- 75%From 53% (2425) to 75% (2526)Single cohort, uncertain basisMunicipality: 79% · Sweden: 72%
- Pupils per teacher Reliability: High reliability.
- 7.6From 7.3 (2425) to 7.6 (2526)Single cohort, uncertain basisMunicipality: 12.3 · Sweden: 12.0
- Permanently employed Reliability: Moderate reliability.
- 96%
- Senior teachers (förstelärare) Reliability: Moderate reliability.
- —Data missing — the Swedish National Agency for Education has not published this value.
- Certified in their teaching subject Reliability: Moderate reliability.
- 53%
- Teachers (FTE) Reliability: Moderate reliability.
- 7.7
- Share of female teachers Reliability: Moderate reliability.
- 78%
- Teacher turnover Reliability: Moderate reliability.
- 7%
Moderate reliability — Mixed sources: certification + student/teacher ratio reported directly to Skolverket; other personnel fields from Skolverket's annual Personal report (1-2 year data lag).
School environment
Safety & Inspection
No active casesRecently inspectedSafety index: 70 / 100
Safety & Inspection
No active cases
Recently inspected
No open remarks from the Schools Inspectorate. Latest decision: Etableringskontroll Skolbeslut Karlstad Backa Friskola, 2018 (pdf, 434 kB).
- Open remarks Reliability: High reliability.
- 0
- Safety index Reliability: High reliability.
- 70 / 100Safety: 84% · Study peace: 59% · Anti-bullying: 56% · Staff: 76%
Safety index
70/ 100(High data coverage)
- Safety84%(national 82)
- Study peace59%(national 57)
- Anti-bullying56%(national 65)
- Staff76%(no national figure)
School Survey — all perspectives
| Dimension | Pupils (åk 5) | Guardian | Staff |
|---|---|---|---|
| Safety | 8.4 / 10 | — | — |
| Study environment | 5.9 / 10 | — | — |
| Anti-bullying | 5.6 / 10 | — | — |
| Stimulation | 7.1 / 10 | — | — |
| Support | 7.3 / 10 | — | — |
Scale 0–10 (rescaled from Skolverket's 0–100). Guardian and staff perspectives are often not in open data.
High reliability — Inspection register and Skolenkäten survey.
Source: Schools Inspectorate + Skolverket · Last updated: 5 Jul 2026
Resources
141,174 SEKCost per pupil (total)Sweden: 144,179 SEK
Resources
141,174 SEK
Cost per pupil (total)
Cost per pupil is 2% below the national average.
Limited history — Cost data updated annually by Kolada/SCB.
Who runs the school
Operator
Nyed Friskola Ekonomisk föreningIndependent operator154 other schools in the municipality.
Operator
Nyed Friskola Ekonomisk förening
Independent operator
Nyed Friskola Ekonomisk förening operates this school independently.
- Operator Reliability: High reliability.
- Nyed Friskola Ekonomisk förening
- Operating form Reliability: High reliability.
- Independent
- Other schools in municipality Reliability: High reliability.
- 154
High reliability — Current data from Skolverket and Bolagsverket.
Source: Skolverket · Last updated: 5 Jul 2026
Next step: Apply for a place
Apply through Karlstad e-service for school choice.
Contact and address
- Headmaster
- Nova Wegerif
- Visiting address
- Skolgatan 7, 65560 Molkom
- Postal address
- Skolgatan 7, 65560 MOLKOM
- Phone
- 076-0283504
- Website
- www.backafriskola.se/
- School unit code
71069295
Source: Skolverket School Unit Register · Pipeline-fetched on 2026-07-05.
Everyday travelAreas that reach the school within 15 minutes.
Reachability from the school
15 min on foot
15 min by bike
School
Daily-life profile
Everyday life at the school
Everyday facts are shown with a source where available. Fields not yet collected are listed together and do not affect score or ranking.
Not collected yet: School day times, After-school care, Language choices, Food and dining, Facilities and outdoor environment, Homework and study support. Suggest an addition →
Nearest and similar schools
- Tolitaskolan27 km away· 90 pupils
- Friskolan Stellatus29 km away· 100 pupils
- Lundsbergs grundskola28 km away· 40 pupils

About Karlstad municipality
School-form averages across the municipality, with links to deep-dive sub-pages.
- Schools
- 155
- Avg. merit (yr 9)
- 232.2+4.5
- Certified teachers
- 80%+6 pp
- Pupils per teacher
- 12.3in line
Source: Skolverket (aggregated school statistics).
Similar schools
The 5 most-similar compulsory schools based on student count, geography, teacher certification and pupil composition.
Pupils per year
Number of pupils per year group (total 58 pupils). Latest available year from Skolverket (SIRIS).
★ Watch Backa Friskola
Get email when new statistics are published, merit value changes significantly or the School Inspectorate makes a new decision.
Want to dig deeper?
The Data view shows complete history, sources, methodology and CSV export.
In-depth metrics
Staff stability
Declining
Source: Kolada (municipality-aggregated certified teacher trend).
Safety and study environment (SkolenkätenThe Schools Inspectorate’s survey sent to pupils, parents, and staff about safety, classroom order, and teaching.Read more in glossary →)
The school survey shows pupil experience where responses are available. Read values together with year, response coverage and unknowns.
Coverage: 1 displayed year group · year 2026.
Strongest (Year 5)
- Safety: 84 (national 82)
- Support: 73 (national 74)
Weakest (Year 5)
- Anti-bullying: 56 (national 65)
- Study environment: 59 (national 57)
Support-needs policy · School-choice guide
Source: Skolinspektionen Skolenkäten 2026. Updated annually. · See all years and dimensions in the data view →
School meals
Weekly menus and meal provider for this school's municipality.
No menu provider registered for this municipality yet.
Source: municipality's own meal portal — Skolkoll does not host menu content.
Inspections & decisions
The Schools Inspectorate has 1 decision on record without critical findings.
Source: Skolinspektionen tillsynsregister (open data). Updated when new decisions are published. · See all decisions and review types in the data view → · Check current status at the Schools Inspectorate ↗
Explore further
More context about Backa Friskola, its municipality, operator and similar schools.
Compulsory schools in KarlstadSee all compulsory schools in the municipality with results and comparisons.Schools in KarlstadOpen the municipality page with all schools, rankings, and local aggregates.Nyed Friskola Ekonomisk föreningSee all schools, municipalities, and core metrics for the same provider.Värmlands länCompare municipalities and school patterns across the whole county.Merit value year 9Compare year-9 merit values across municipalities and school environments.Certification vs Merit valueSee how merit values and upper-secondary eligibility move together.School size by school typeSee how school forms and unit sizes are distributed nationally.School type distributionCompare how school forms are distributed across municipalities and operators.
Data coverage
What we do not know about Backa Friskola
Open school data is not complete. Use this as a checklist for what to verify with the school, provider or municipality.
- MediumResults and score inputsMedium data coverage: 3 of 5 score dimensions have school-specific data. When school-specific data is missing for a dimension, the neutral value 50 is used. That does not automatically lower the school, but it makes the score less informative.
- MediumEligibility and goal attainmentGrades, eligibility and goal-attainment data may be missing, suppressed or available only for some grades and school types.
- UncertainResources, teachers and staffTeacher and resource metrics do not always show subject mix, vacancies, student-health workflows or everyday staffing.
- MissingSupport resources and student healthWe do not yet have a verified national data source for special education, student health, adaptations, language support or contact routes per school.
- PartialSafety and study environmentThe school survey is shown where available, but not every grade and perspective is always covered.
- UncertainAdmissions, placement and important datesMunicipal placement rules, queues and important dates require a local source and should be checked with the municipality or school.
- MissingVisits, facilities and everyday environmentWe lack sourced open-house information for this school. Facilities, accessibility and everyday environment are often not open comparable data.
For the school: get your Skolkoll badge
Work at this school? Embed an image showing the school's Skolkoll score that links to the full profile. The image is served from Skolkoll's image host and updates when we publish a new badge for the school.
See Data view for full sources and fetch dates per source.