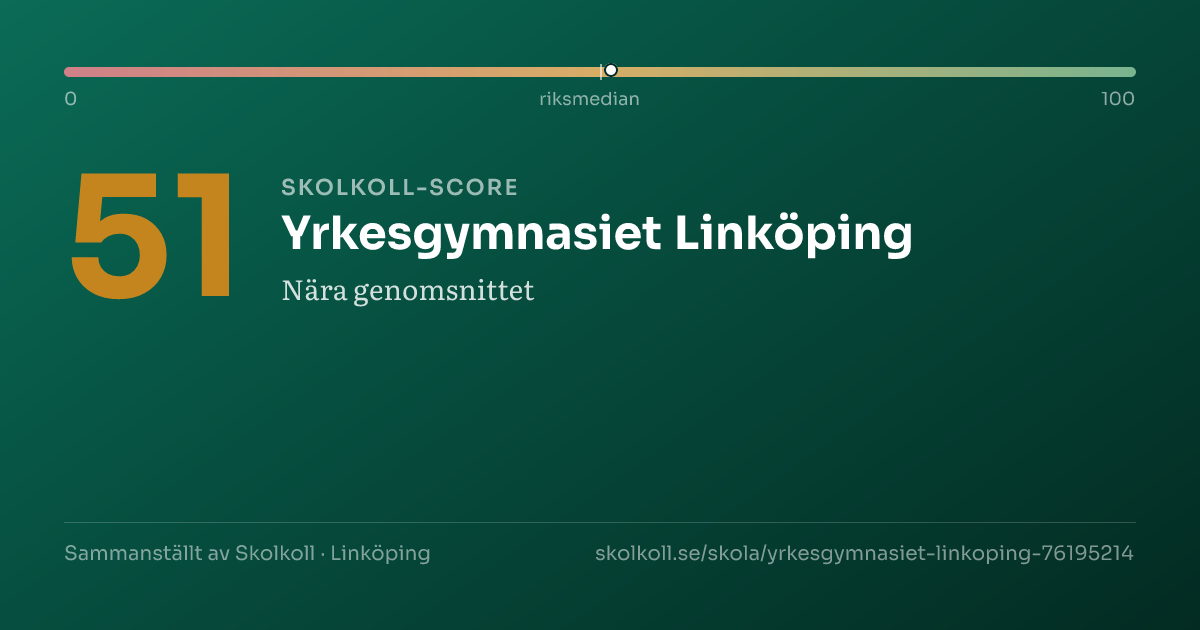
51
Skolkoll Score 51 out of 100. The scale goes from 0 (lowest) to 100 (highest). 50 is the average. Better than 32% of Sweden’s upper secondary schools.below the national midpointShows where a school sits within a comparison group. Percentile 80 means the school ranks above roughly 80 percent of that group.Compared to all upper-secondary schools nationally
A composite of five open data sources — a starting point, not a grade.
Data coverageMedium3/5
Why this score?
Skolkoll score is Skolkoll's composite indicator based on available data sources. It is not an official quality measure and should be read together with the underlying data.
3 of 5 score dimensions have school-specific data.
When school-specific data is missing for a dimension, the neutral value 50 is used. That does not automatically lower the school, but it makes the score less informative.

Yrkesgymnasiet Linköping is a medium-sized group-operated upper secondary school with 180 pupils.
Yrkesgymnasiet Linköping is a medium-sized group-operated upper secondary school with 180 pupils. The share of qualified teachers (94%) is above the national average of 78%.
- 180PupilsMunicipality: 7,640High reliability
- 94%Qualified teachersMunicipality: 85% · Sweden: 78%High reliability
- 13.0Graduation gradeMunicipality: 13.6 · Sweden: 13.8Moderate reliability
- 14.5Pupils per teacherMunicipality: 13.1 · Sweden: 12.1High reliability
- 146,110 SEKCost per pupil (municipal avg.)Sweden: 144,179 SEKLimited history
See how schools in Linköping rank →
The most important facts in 3 points
- Upper secondary school in Linköping with 180 pupils.
- The latest record is a review or decision without risk classification.
- Applying? Go to the school's application link on this page.
Skolkoll interpretation
Yrkesgymnasiet Linköping is compared here with 26 other schools with the same school form in Linköping municipality; it has 180 pupils versus the municipal average of 283.
The average graduation grade is 13.0, 0.6 points below the municipal average and 0.8 points below the national average.
Qualified teachers: 94%, 9 percentage points above the municipal average and 16 percentage points above the national average.
Pupils per teacher is 14.5, 1.4 higher than the municipal average.
Apply for a place? Use Linköping e-service for upper-secondary application (opens in a new window).
Eligible for higher education and Graduation rate need extra caution
This applies only to the values listed here.
This value is missing in full or in part.
This affects
- Eligible for higher education
- Graduation rate
- This result metric can be affected by privacy suppression, small cohorts, and changes in pupil composition between years.
Other values here do not have this specific note.
School programmes
- Upper secondary school
Things to look into
No clear flag.
No clear attention flags from key-figure deviations or the School Inspectorate's public register. Detailed inspection history is shown in the "Safety & Inspection" card below.
School profile
The school's strengths compared with all upper-secondary schools nationally.
- Grade pointsP32
- Certified teachersP85
- Pupil-teacher ratioP28
Source: Skolverket, Swedish Schools Inspectorate.
Aerial view of the school
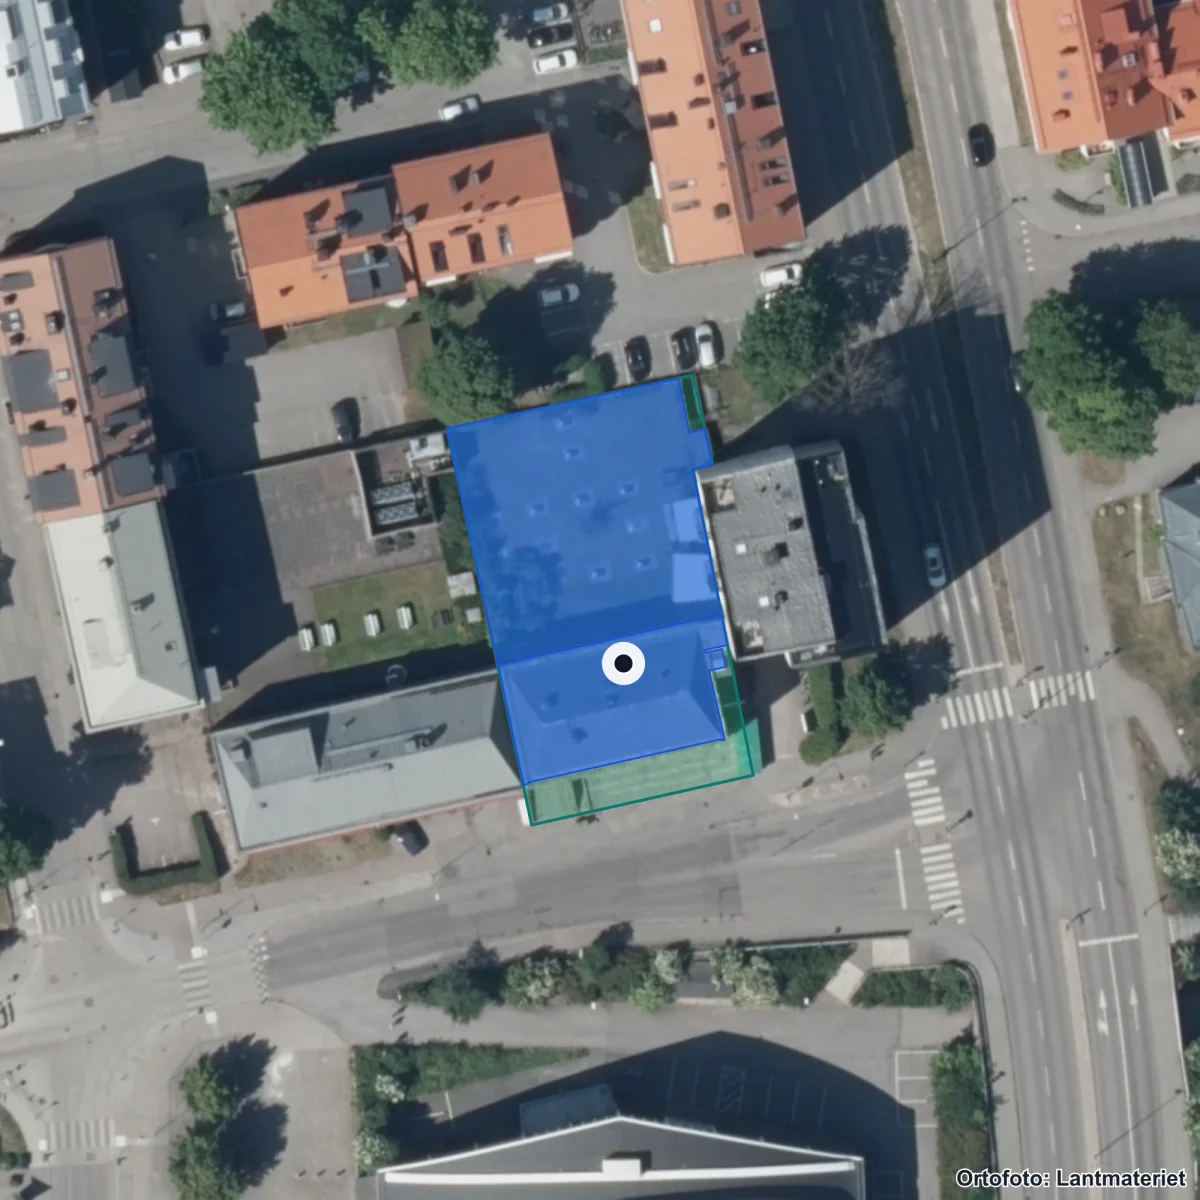
The school's property boundary and buildings from the Swedish Land Survey's property register. Updated 2026. Source: Lantmäteriet · CC BY 4.0
Entrances:1 Linköping, Linnégatan 7, Linköping
School performance
Results
13.0Avg. graduation gradeSweden: 13.8
Results
13.0
Avg. graduation grade
Average graduation grade is 0.8 points below the national average.
Admission scores per programme
| Programme | Avg. | Sweden | Difference |
|---|---|---|---|
| Bygg- och anläggningsprogrammet | 112.5 | — | |
| El- och energiprogrammet | 182.5 | — | |
| Frisör- och stylistprogrammet | 105 | — | |
| Försäljnings- och serviceprogrammet | 120 | — | |
| Fordons- och transportprogrammet | 85 | — | |
| Hotell- och turismprogrammet | 152.5 | — | |
| VVS- och fastighetsprogrammet | 150 | — | |
| Vård- och omsorgsprogrammet | 102.5 | — |
Lowest admitted merit score from latest admission round. Smaller programmes (under 20 places) have larger year-to-year variation.
After graduation (3 years)
| Outcome | Share |
|---|---|
| Studying in higher education | 38.6% |
| Established in the labor market (vocational programmes) | 42.9% |
| Established in the labor market (introduction programmes) | 39.3% |
Source: Skolverket Statistikdatabasen (per school unit, 3 years after graduation). Rows are independent outcome metrics and do not sum to 100%. One-year follow-up and a university-vs-other-studies split are not published in open data per school.
Moderate reliability — Mixed sources: results reported directly by the school operator; post-graduation outcomes (3 years) from Skolverket Statistikdatabasen.
Staff
94%Qualified teachersMunicipality: 85% · Sweden: 78%
Staff
94%
Qualified teachers
94% of teachers hold a pedagogical degree — 16 percentage points above the national average.
High reliability — Reported directly by the school operator.
School environment
Safety & Inspection
No active casesRecently inspected
Safety & Inspection
No active cases
Recently inspected
No open remarks from the Schools Inspectorate. Latest decision: Regelb. tillsyn Skolbeslut Linköping Yrkesgymnasiet Linköping, 2015 (pdf, 2899 kB).
- Open remarks Reliability: High reliability.
- 0
High reliability — Inspection register and Skolenkäten survey.
Source: Schools Inspectorate + Skolverket · Last updated: 5 Jul 2026
Resources
146,110 SEKCost per pupil (total)Sweden: 144,179 SEK
Resources
146,110 SEK
Cost per pupil (total)
Cost per pupil is 1% above the national average.
Limited history — Cost data updated annually by Kolada/SCB.
Who runs the school
Operator
Edukatus Alliance Holding ABGroup operator282 other schools in the municipality.
Operator
Edukatus Alliance Holding AB
Group operator

Edukatus Alliance Holding AB operates this school as part of a larger concern.
- Operator Reliability: High reliability.
- Edukatus Alliance Holding AB
- Operating form Reliability: High reliability.
- Group-operated
- Concern (parent organisation) Reliability: High reliability.
- Edukatus Alliance Holding AB
- Concern org. number Reliability: High reliability.
- 5594719139
- Other schools in municipality Reliability: High reliability.
- 282
High reliability — Current data from Skolverket and Bolagsverket.
Source: Skolverket · Last updated: 5 Jul 2026
Next step: Apply for a place
Apply through Linköping e-service for upper-secondary application.
Contact and address
- Headmaster
- Angelica Högberg
- Visiting address
- Linnégatan 7, 58225 Linköping
- Postal address
- Stora Nygatan 52, 21137 MALMÖ
- Phone
- 090-124600
- School unit code
76195214
Source: Skolverket School Unit Register · Pipeline-fetched on 2026-07-05.
Everyday travelAreas that reach the school within 15 minutes.
Reachability from the school
15 min on foot
15 min by bike
School
Daily-life profile
Everyday life at the school
Everyday facts are shown with a source where available. Fields not yet collected are listed together and do not affect score or ranking.
Not collected yet: School day times, After-school care, Language choices, Food and dining, Facilities and outdoor environment, Homework and study support. Suggest an addition →
Nearest and similar schools
- Linnégymnasiet 30 km away· 180 pupils
- Anders Ljungstedts gymnasium 91 km away· 240 pupils
- Folkungaskolan 31 km away· 150 pupils

About Linköping municipality
School-form averages across the municipality, with links to deep-dive sub-pages.
- Schools
- 283
- Avg. merit (yr 9)
- 235.6+7.9
- Certified teachers
- 82%+8 pp
- Pupils per teacher
- 11.6in line
Source: Skolverket (aggregated school statistics).
Similar schools
The 5 most-similar upper secondary schools based on student count, geography, teacher certification and pupil composition.
★ Watch Yrkesgymnasiet Linköping
Get email when new statistics are published, merit value changes significantly or the School Inspectorate makes a new decision.
Want to dig deeper?
The Data view shows complete history, sources, methodology and CSV export.
In-depth metrics
Staff stability
Improving
Source: Kolada (municipality-aggregated certified teacher trend).
School meals
Weekly menus and meal provider for this school's municipality.
No menu provider registered for this municipality yet.
Source: municipality's own meal portal — Skolkoll does not host menu content.
Inspections & decisions
The Schools Inspectorate has 7 decisions on record without critical findings.
Source: Skolinspektionen tillsynsregister (open data). Updated when new decisions are published. · See all decisions and review types in the data view → · Check current status at the Schools Inspectorate ↗
Admissions pressure & cutoffs
Applicants per place and latest admission cutoff per programme (2026).
High demand reflects popularity, which depends on location and reputation as well as quality. Cutoffs measure entry difficulty, not school quality.
- Bygg- och anläggningsprogrammet112.5points
- El- och energiprogrammet182.5points
- Frisör- och stylistprogrammet105points
- Försäljnings- och serviceprogrammet120points
- Fordons- och transportprogrammet85points
- Hotell- och turismprogrammet152.5points
- Hantverksprogrammet
- Introduktionsprogram IM
- VVS- och fastighetsprogrammet150points
- Vård- och omsorgsprogrammet102.5points
Source: Gymnasieantagningen (regional admission databases). Latest year: 2026.
Explore further
More context about Yrkesgymnasiet Linköping, its municipality, operator and similar schools.
Upper secondary schools in LinköpingSee all upper secondary schools in the municipality with graduation rates.Schools in LinköpingOpen the municipality page with all schools, rankings, and local aggregates.Edukatus Alliance ABSee all schools, municipalities, and core metrics for the same provider.Edukatus Alliance Holding ABOpen the full school-group page with providers, municipalities, and group totals.Östergötlands länCompare municipalities and school patterns across the whole county.Upper secondary schoolsGet the national upper-secondary overview of school size and outcomes.Cost vs ResultsCompare outcomes and resource levels across municipalities and school markets.Compare schoolsBuild a side-by-side comparison with the schools you care about.
Data coverage
What we do not know about Yrkesgymnasiet Linköping
Open school data is not complete. Use this as a checklist for what to verify with the school, provider or municipality.
- MediumResults and score inputsMedium data coverage: 3 of 5 score dimensions have school-specific data. When school-specific data is missing for a dimension, the neutral value 50 is used. That does not automatically lower the school, but it makes the score less informative.
- MediumEligibility and goal attainmentGrades, eligibility and goal-attainment data may be missing, suppressed or available only for some grades and school types.
- UncertainResources, teachers and staffTeacher and resource metrics do not always show subject mix, vacancies, student-health workflows or everyday staffing.
- MissingSupport resources and student healthWe do not yet have a verified national data source for special education, student health, adaptations, language support or contact routes per school.
- MissingSafety and study environmentWe lack current or displayable survey data about safety and study environment for this school.
- PartialAdmissions, placement and important datesAdmission data is available for upper-secondary programmes where sources publish it, but it is historical and not a forecast.
- MissingVisits, facilities and everyday environmentWe lack sourced open-house information for this school. Facilities, accessibility and everyday environment are often not open comparable data.
For the school: get your Skolkoll badge
Work at this school? Embed an image showing the school's Skolkoll score that links to the full profile. The image is served from Skolkoll's image host and updates when we publish a new badge for the school.
See Data view for full sources and fetch dates per source.