top 22%Shows where a school sits within a comparison group. Percentile 80 means the school ranks above roughly 80 percent of that group.Compared to all upper-secondary schools nationally
0median100
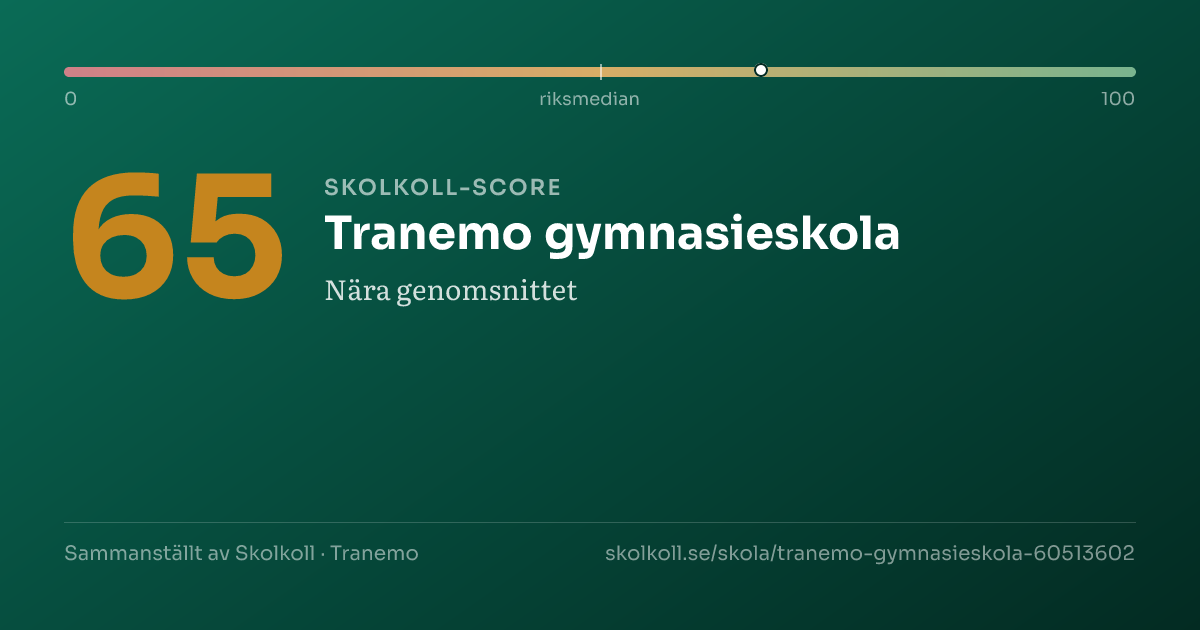
Skolkoll Score 65 out of 100. The scale goes from 0 (lowest) to 100 (highest). 50 is the average. Better than 78% of Sweden’s upper secondary schools.
A composite of five open data sources — a starting point, not a grade.
Data coverageHigh4/5
Why this score?
Skolkoll score is Skolkoll's composite indicator based on available data sources. It is not an official quality measure and should be read together with the underlying data.
4 of 5 score dimensions have school-specific data.
When school-specific data is missing for a dimension, the neutral value 50 is used. That does not automatically lower the school, but it makes the score less informative.
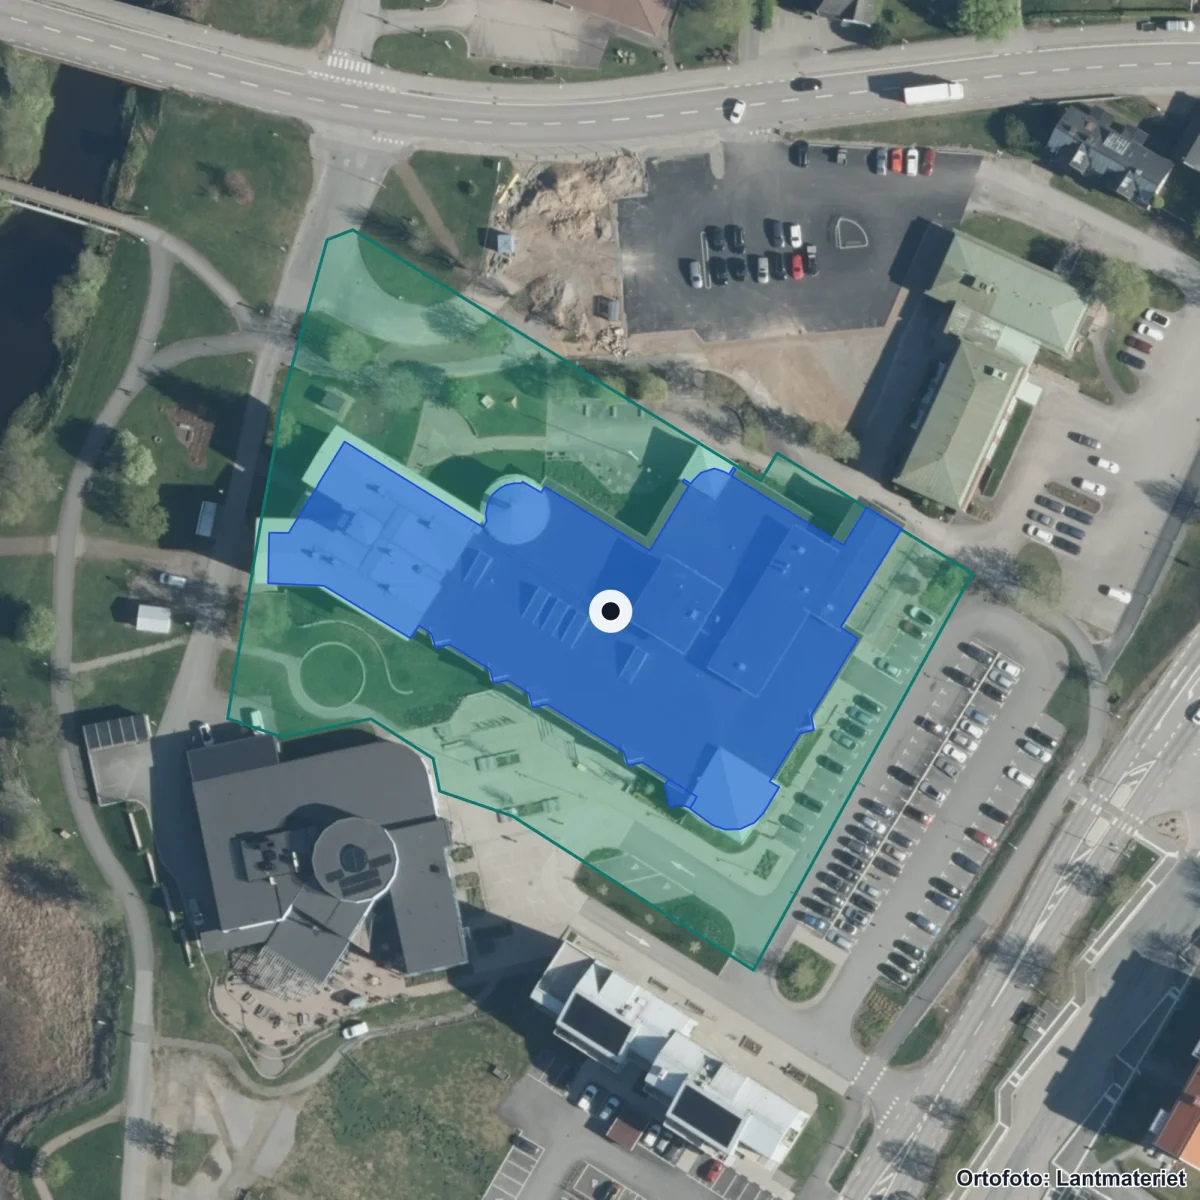
Tranemo gymnasieskola is a medium-sized municipal upper secondary school with 310 pupils.
Tranemo gymnasieskola is a medium-sized municipal upper secondary school with 310 pupils. The share of qualified teachers (82%) is above the national average of 78%.
No clear attention flags from key-figure deviations or the School Inspectorate's public register. Detailed inspection history is shown in the "Safety & Inspection" card below.
School profile
The school's strengths compared with all upper-secondary schools nationally.
14.9▲ +1.7From 13.2 (2223) to 14.9 (2425)Sweden: 13.8
Examination rate (3 yr)● Reliability: High reliability.
91.7%Sweden: 82.4%
Admission scores per programme
Programme
Avg.
Sweden
Difference
Bygg- och anläggningsprogrammet
100
—
→
El- och energiprogrammet
167.5
—
→
Ekonomiprogrammet
195
—
→
Försäljnings- och serviceprogrammet
137.5
—
→
Industritekniska programmet
210
—
→
Naturvetenskapsprogrammet
185
—
→
Samhällsvetenskapsprogrammet
147.5
—
→
Teknikprogrammet
162.5
—
→
Vård- och omsorgsprogrammet
155
—
→
Lowest admitted merit score from latest admission round. Smaller programmes (under 20 places) have larger year-to-year variation.
After graduation (3 years)
Outcome
Share
Studying in higher education
47.6%
Established in the labor market (vocational programmes)
45.1%
Source: Skolverket Statistikdatabasen (per school unit, 3 years after graduation). Rows are independent outcome metrics and do not sum to 100%. One-year follow-up and a university-vs-other-studies split are not published in open data per school.
◐Moderate reliability — Mixed sources: results reported directly by the school operator; post-graduation outcomes (3 years) from Skolverket Statistikdatabasen.
Safety and study environment (SkolenkätenThe Schools Inspectorate’s survey sent to pupils, parents, and staff about safety, classroom order, and teaching.Read more in glossary →)
The school survey shows pupil experience where responses are available. Read values together with year, response coverage and unknowns.
Open school data is not complete. Use this as a checklist for what to verify with the school, provider or municipality.
HighResults and score inputsHigh data coverage: 4 of 5 score dimensions have school-specific data. When school-specific data is missing for a dimension, the neutral value 50 is used. That does not automatically lower the school, but it makes the score less informative.
HighEligibility and goal attainmentGrades, eligibility and goal-attainment data may be missing, suppressed or available only for some grades and school types.
PartialResources, teachers and staffTeacher and resource metrics do not always show subject mix, vacancies, student-health workflows or everyday staffing.
MissingSupport resources and student healthWe do not yet have a verified national data source for special education, student health, adaptations, language support or contact routes per school.
PartialSafety and study environmentThe school survey is shown where available, but not every grade and perspective is always covered.
PartialAdmissions, placement and important datesAdmission data is available for upper-secondary programmes where sources publish it, but it is historical and not a forecast.
MissingVisits, facilities and everyday environmentWe lack sourced open-house information for this school. Facilities, accessibility and everyday environment are often not open comparable data.
Places, admission and support are decided by the school, provider or municipality. Use this as a checklist, not a promise of outcome.
For the school: get your Skolkoll badge
Work at this school? Embed an image showing the school's Skolkoll score that links to the full profile. The image is served from Skolkoll's image host and updates when we publish a new badge for the school.
Data sources: Skolverket, Kolada (RKA/SKR), SCB · Updated 2026-07-05
Method
About this value
Cookie settings
We use cookies for visitor statistics, A/B testing and site improvement (Google Analytics 4 with IP anonymization and Zoho PageSense, which may include heatmaps and session recording on public pages). Skolkoll does not sell visitor data and shows no advertising. Read more in our privacy policy