Tallåsskolan is a small municipal compulsory school with 30 pupils.
Tallåsskolan is a small municipal compulsory school with 30 pupils.
- 30PupilsMunicipality: 450High reliability
- 188,043 SEKCost per pupil (municipal avg.)Sweden: 144,179 SEKLimited history
The most important facts in 3 points
- Compulsory school in Högsby with 30 pupils.
- No current inspection decision is available in the open Schools Inspectorate data.
- Applying? Go to the school's application link on this page.
Apply for a place? Use Högsby e-service for school choice (opens in a new window).
Certified teachers and Pupils per teacher need extra caution
This applies only to the values listed here.
This value is missing in full or in part.
This affects
- Certified teachers
- Pupils per teacher
- This staffing metric is affected by FTE definitions, local reporting practices, and temporary vacancies.
Other values here do not have this specific note.
School programmes
- Compulsory school
Things to look into
No clear flag.
No clear attention flags from key-figure deviations or the School Inspectorate's public register. Detailed inspection history is shown in the "Safety & Inspection" card below.
Aerial view of the school
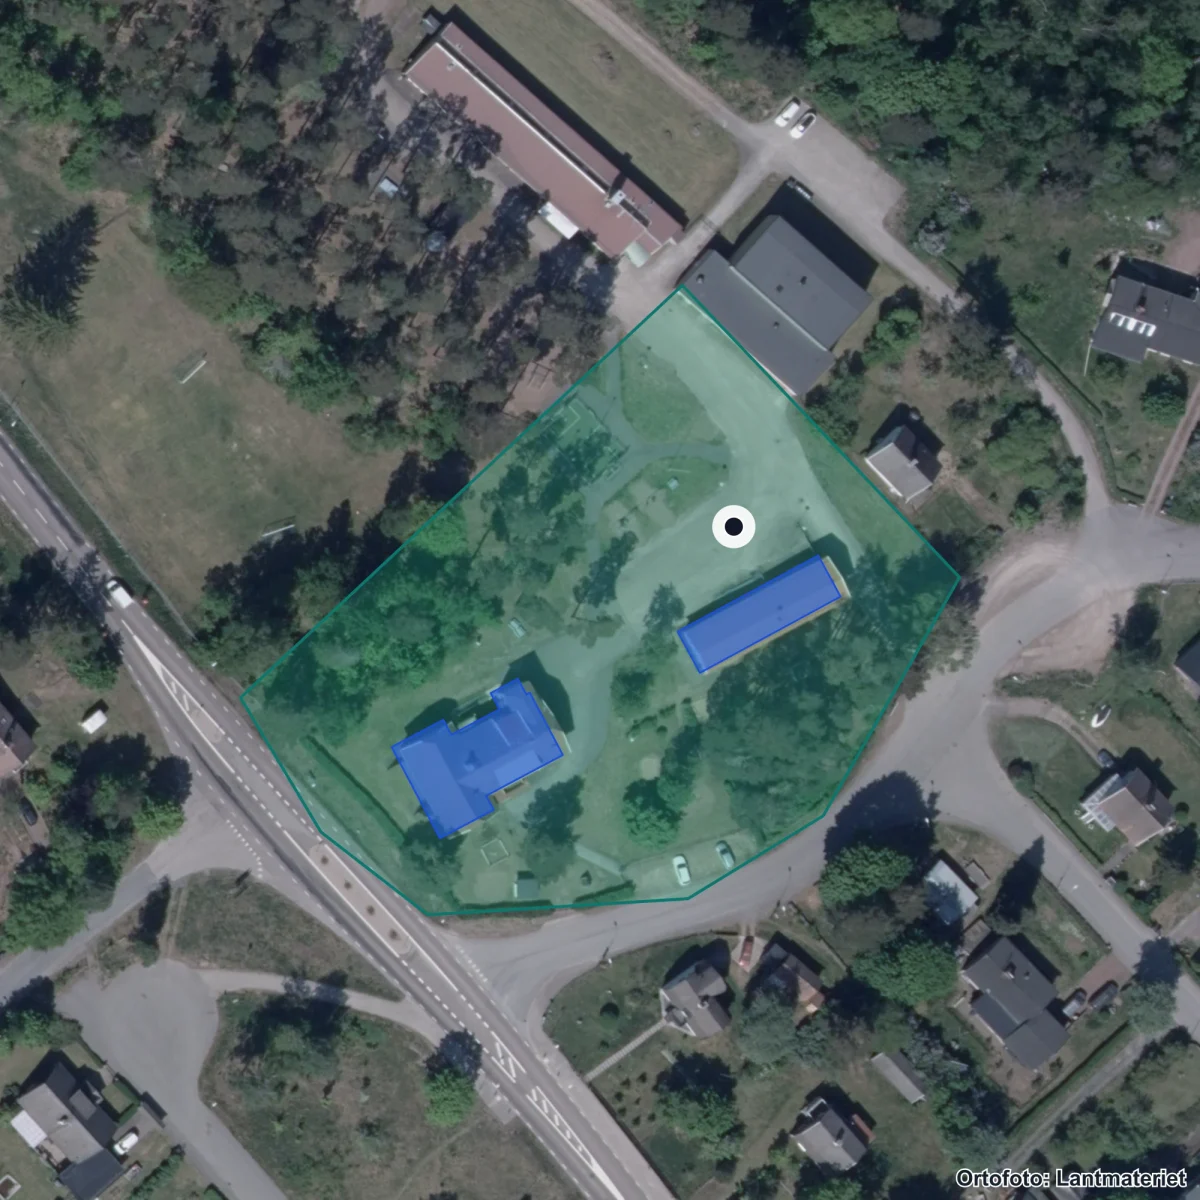
The school's property boundary and buildings from the Swedish Land Survey's property register. Updated 2026. Source: Lantmäteriet · CC BY 4.0
Entrances:1 Högsby, Skolgatan 1B, Ruda
School environment
Safety & Inspection
No active casesRecently inspected
Safety & Inspection
No active cases
Recently inspected
No open remarks from the Schools Inspectorate.
- Open remarks Reliability: High reliability.
- 0
High reliability — Inspection register and Skolenkäten survey.
Source: Schools Inspectorate + Skolverket · Last updated: 5 Jul 2026
Resources
188,043 SEKCost per pupil (total)Sweden: 144,179 SEK
Resources
188,043 SEK
Cost per pupil (total)
Cost per pupil is 30% above the national average.
Limited history — Cost data updated annually by Kolada/SCB.
Who runs the school
Operator
HÖGSBY KOMMUNMunicipal operator11 other schools in the municipality.
Operator
HÖGSBY KOMMUN
Municipal operator

HÖGSBY KOMMUN is the operator. The municipality has 11 other schools.
- Operator Reliability: High reliability.
- HÖGSBY KOMMUN
- Operating form Reliability: High reliability.
- Municipal own operation
- Other schools in municipality Reliability: High reliability.
- 11
High reliability — Current data from Skolverket and Bolagsverket.
Source: Skolverket · Last updated: 5 Jul 2026
Next step: Apply for a place
Apply through Högsby e-service for school choice.
Contact and address
- Headmaster
- Åsa Norrsén
- Visiting address
- Skolgatan 1, 57971 Ruda
- Postal address
- 57980 HÖGSBY
- Phone
- 010-3565212
- Website
- www.hogsby.se/
- School unit code
84104026
Source: Skolverket School Unit Register · Pipeline-fetched on 2026-07-05.
Everyday travelAreas that reach the school within 15 minutes.
Reachability from the school
15 min on foot
15 min by bike
School
Support and inclusion
Support and student health
This panel shows sourced support-resource data where available and marks the rest as missing or uncertain. These fields do not affect score or ranking.
Missing or uncertain support-resource fields
- MissingStudent health teamIs there sourced information about student health functions at the school?
- PartialSpecial educatorThe source does not split special educators and special needs teachers per school unit in this model.
- PartialSpecial needs teacherThe source does not split special educators and special needs teachers per school unit in this model.
- MissingSchool nurseIs there sourced information about school nurse resources?
- MissingPsychologistIs there sourced information about psychologist resources?
- MissingStudy and career guidanceIs there sourced information about study and career guidance?
- MissingLanguage supportIs there sourced information about language or mother-tongue support?
- MissingAdaptations and special supportIs there verified process information for adaptations and special support?
- MissingAccessibilityIs there sourced information about physical or pedagogical accessibility?
- MissingContact routeIs there a verified contact route for support questions?
Privacy rule: no individual pupil health, diagnosis, support decision or personal case data may be stored.
Nearest and similar schools
- Urfjälls Montessoriskola· 50 pupils
- Skyttefällaskolan F-313 km away· 10 pupils
- Bockaraskolan17 km away· 30 pupils
About Högsby municipality
School-form averages across the municipality, with links to deep-dive sub-pages.
- Schools
- 12
- Avg. merit (yr 9)
- 193.1−34.6
- Certified teachers
- 48%−26 pp
- Pupils per teacher
- 10.6−1.4
Source: Skolverket (aggregated school statistics).
Similar schools
The 5 most-similar compulsory schools based on student count, geography, teacher certification and pupil composition.
Pupils per year
Number of pupils per year group (total 25 pupils). Latest available year from Skolverket (SIRIS).
★ Watch Tallåsskolan
Get email when new statistics are published, merit value changes significantly or the School Inspectorate makes a new decision.
Want to dig deeper?
The Data view shows complete history, sources, methodology and CSV export.
In-depth metrics
Staff stability
Improving
Source: Kolada (municipality-aggregated certified teacher trend).
School meals
Weekly menus and meal provider for this school's municipality.
No menu provider registered for this municipality yet.
Source: municipality's own meal portal — Skolkoll does not host menu content.
Explore further
More context about Tallåsskolan, its municipality, operator and similar schools.
Compulsory schools in HögsbySee all compulsory schools in the municipality with results and comparisons.Schools in HögsbyOpen the municipality page with all schools, rankings, and local aggregates.Högsby kommunSee all schools, municipalities, and core metrics for the same provider.Kalmar länCompare municipalities and school patterns across the whole county.Merit value year 9Compare year-9 merit values across municipalities and school environments.Certification vs Merit valueSee how merit values and upper-secondary eligibility move together.School size by school typeSee how school forms and unit sizes are distributed nationally.School type distributionCompare how school forms are distributed across municipalities and operators.
Data coverage
What we do not know about Tallåsskolan
Open school data is not complete. Use this as a checklist for what to verify with the school, provider or municipality.
- MissingResults and score inputsSkolkoll score is not shown for this school type or lacks enough underlying data.
- MissingEligibility and goal attainmentGrades, eligibility and goal-attainment data may be missing, suppressed or available only for some grades and school types.
- UncertainResources, teachers and staffTeacher and resource metrics do not always show subject mix, vacancies, student-health workflows or everyday staffing.
- PartialSupport resources and student healthSome support-resource fields have sourced statistics, but several parts are still missing or reported only in aggregate.
- MissingSafety and study environmentWe lack current or displayable survey data about safety and study environment for this school.
- UncertainAdmissions, placement and important datesMunicipal placement rules, queues and important dates require a local source and should be checked with the municipality or school.
- MissingVisits, facilities and everyday environmentWe lack sourced open-house information for this school. Facilities, accessibility and everyday environment are often not open comparable data.
See Data view for full sources and fetch dates per source.