
Staff stability
Declining
Source: Kolada (municipality-aggregated certified teacher trend).
SOLBACKENS FÖRSKOLA is a small independent preschool with 33 children.
SOLBACKENS FÖRSKOLA is a small independent preschool with 33 children. The share of staff with pedagogical higher education (36.5%) is below the national average of 43.6%.
SOLBACKENS FÖRSKOLA is compared here with 8 other schools with the same school form in Tibro municipality; it has 33 children versus the municipal average of 57.
Share with pedagogical higher education: 36.5%, 18.9 percentage points below the municipal average and 7.1 percentage points below the national average.
Children per staff member is 4.5, 0.3 lower than the municipal average.
Apply for a place? Use Tibro e-service for preschool application (opens in a new window).
No clear attention flags from key-figure deviations or the School Inspectorate's public register. Detailed inspection history is shown in the "Safety & Inspection" card below.
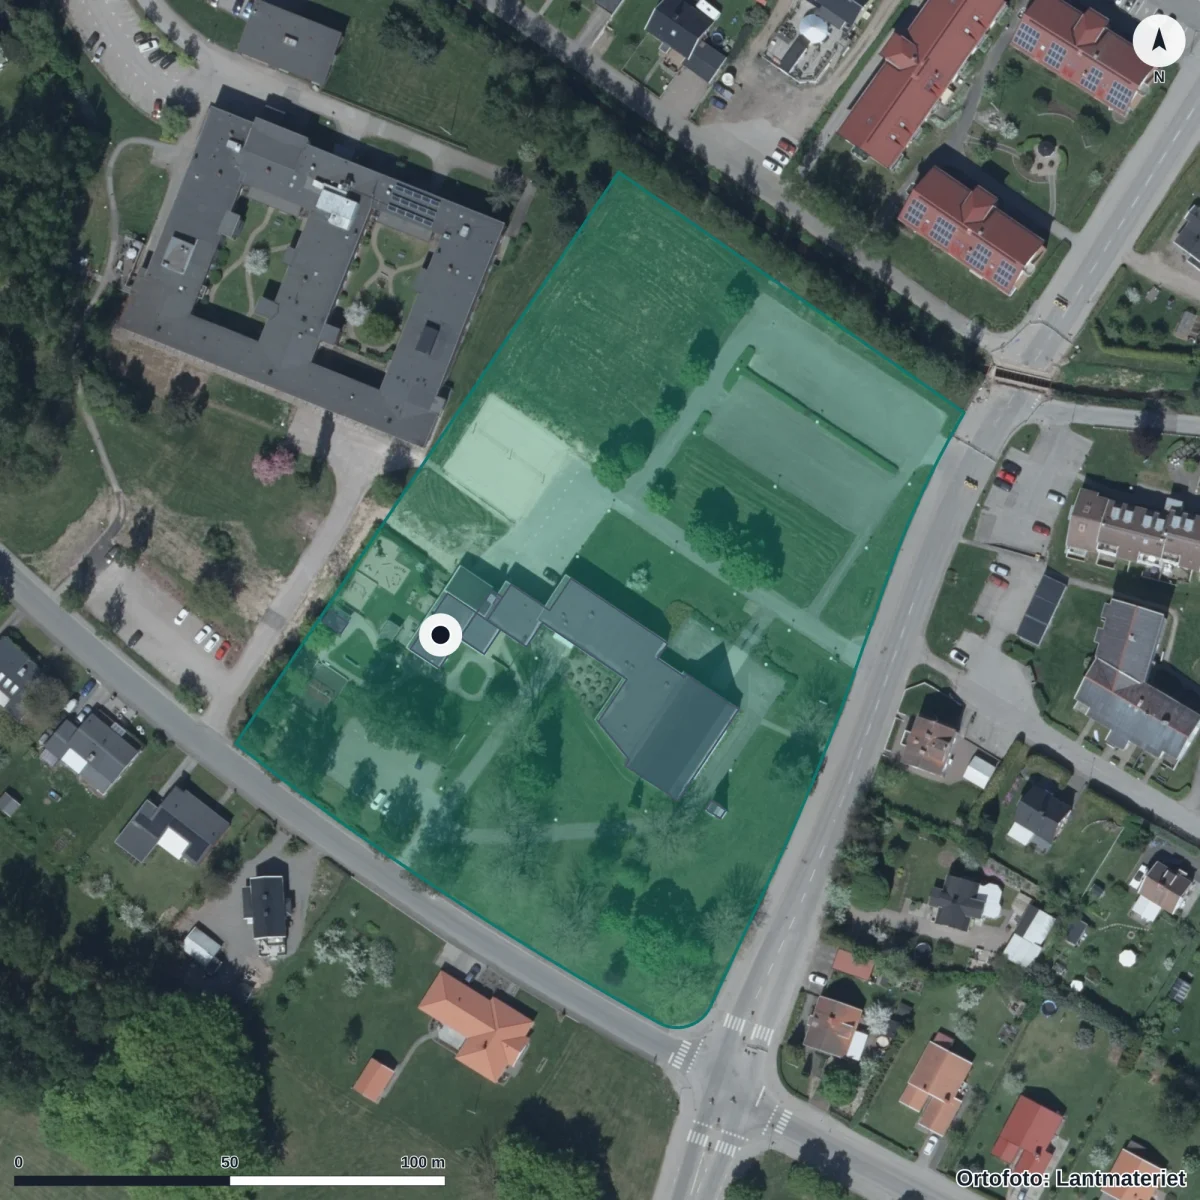
Aerial view of the school's surroundings. The property is marked from the register; building use has not been verified. Updated 2026. Source: Lantmäteriet · CC BY 4.0
Entrances:1 Tibro, Villagatan 29, Tibro
Municipality: 55.4% · Sweden: 43.6%
No open remarks from the Schools Inspectorate.
Source: Schools Inspectorate + Skolverket · Last updated: 5 Jul 2026
16 other schools in the municipality.
SOLBACKENS FÖRSKOLA TIBRO MISSIONSKYRKA operates this school independently.
Source: Skolverket · Last updated: 5 Jul 2026
Apply through Tibro e-service for preschool application.
forsk-954262Source: Skolverket School Unit Register · Pipeline-fetched on 2026-07-05.
Everyday travelAreas that reach the school within 15 minutes.
School-form averages across the municipality, with links to deep-dive sub-pages.
Source: Skolverket (aggregated school statistics).
Get email when new statistics are published, merit value changes significantly or the School Inspectorate makes a new decision.
The Data view shows complete history, sources, methodology and CSV export.
Source: Kolada (municipality-aggregated certified teacher trend).
Key figures for SOLBACKENS FÖRSKOLA. Compared to municipal and national averages.
Skolverket's mutually exclusive categories for staff in the preschool unit.
| Category | This preschool | Municipality | National |
|---|---|---|---|
| Pedagogical higher educationpreschool teachers and others with a Swedish higher-education degree | 37% | 55.4% | 43.6% |
| Upper-secondary qualification for work with childrenchildcare assistant training or equivalent | 27% | 4.9% | 15.4% |
| Some pedagogical trainingfor example parts of a pedagogical education | 37% | – | – |
| Other educationother education, including foreign qualifications not validated in Sweden | 0% | – | – |
| Other educational background (combined)comparison row for the two categories that municipal and national statistics publish together | 37% | 39.7% | 40.2% |
Of which preschool-teacher degree: 37%
National average calculated from all 290 municipalities. Municipal data is aggregated and applies to all preschools in Tibro. Source: Skolverket preschool statistics. Updated annually.
More context about Solbackens Förskola, its municipality, operator and similar schools.
Data coverage
Open school data is not complete. Use this as a checklist for what to verify with the school, provider or municipality.
See Data view for full sources and fetch dates per source.