Noretsskolan is a small municipal adapted compulsory school.
Noretsskolan is a small municipal adapted compulsory school.
- 145,070 SEKCost per pupil (municipal avg.)Sweden: 144,179 SEKLimited history
The most important facts in 3 points
- Adapted compulsory school in Mora. Pupil count is missing from the latest open data.
- No current inspection decision is available in the open Schools Inspectorate data.
- Applying? Contact the municipality or provider for the current application route.
3 values need extra caution
This applies only to the values listed here.
This value is missing in full or in part.
This affects
- Eligible for vocational programmes
- Merit score year 9
- SALSA score
- This result metric can be affected by privacy suppression, small cohorts, and changes in pupil composition between years.
- SALSA is model-based and becomes less stable for small pupil groups or schools with rapidly changing pupil composition.
Other values here do not have this specific note.
School programmes
- Adapted compulsory school
Things to look into
No clear flag.
No clear attention flags from key-figure deviations or the School Inspectorate's public register. Detailed inspection history is shown in the "Safety & Inspection" card below.
Aerial view of the school
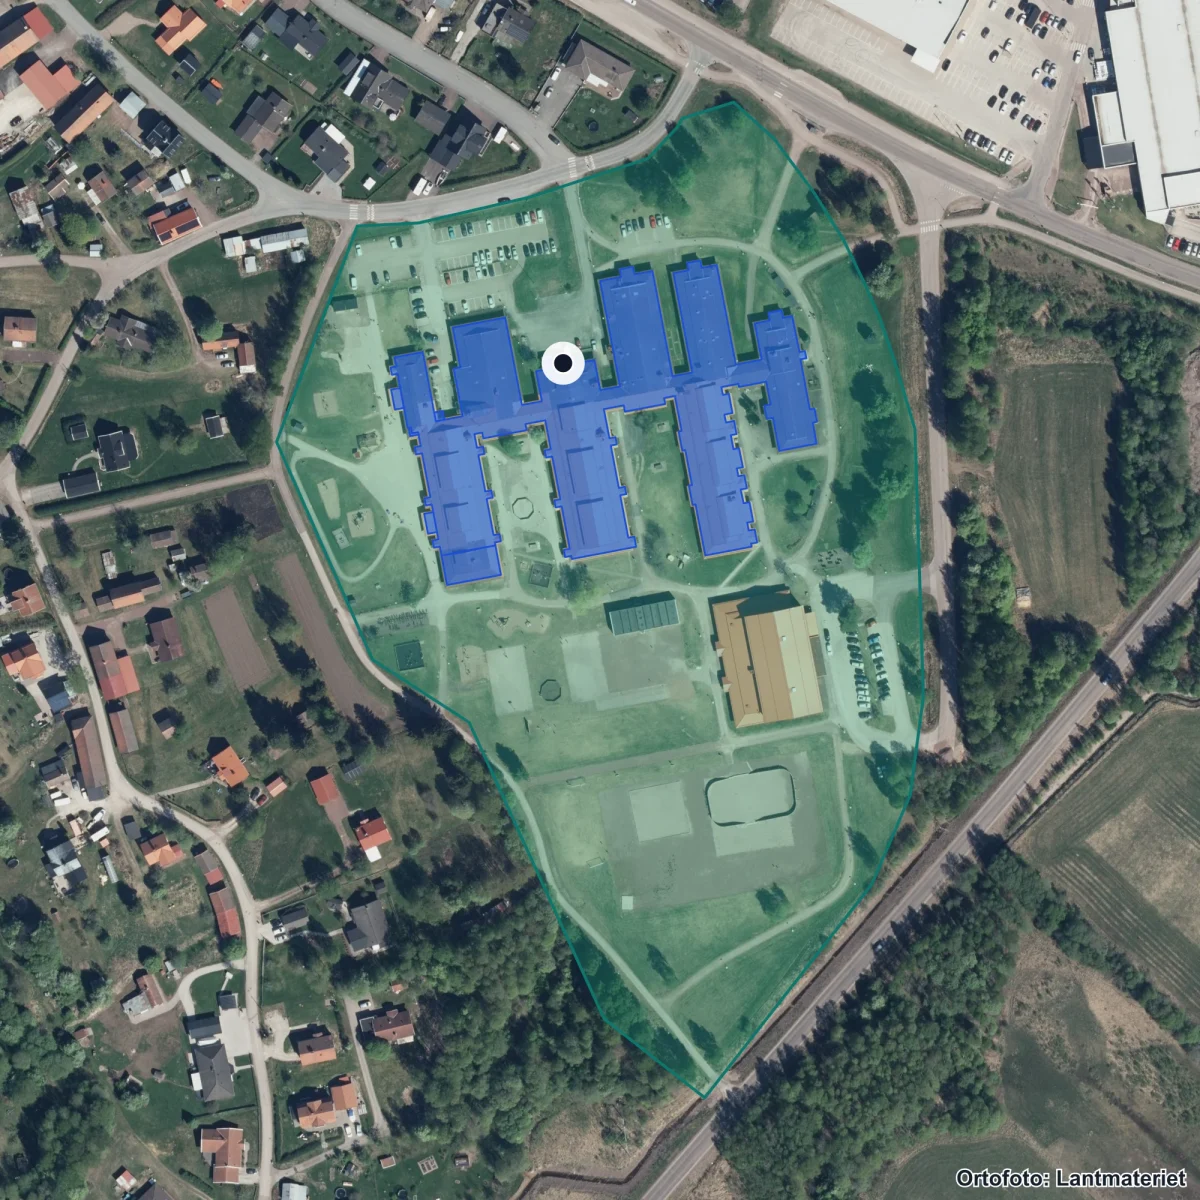
The school's property boundary and buildings from the Swedish Land Survey's property register. Updated 2026. Source: Lantmäteriet · CC BY 4.0
Entrances:1 Mora, Norebergsvägen 40, Mora
School performance
Staff
83%Permanently employed
Staff
83%
Permanently employed
Staff data reported by the school operator.
- Permanently employed Reliability: Moderate reliability.
- 83%
- Senior teachers (förstelärare) Reliability: Moderate reliability.
- —Data missing — the Swedish National Agency for Education has not published this value.
- Pupils per counsellor Reliability: Moderate reliability.
- 1,934.0
- Certified in their teaching subject Reliability: Moderate reliability.
- 67%
- Teachers (FTE) Reliability: Moderate reliability.
- 188.1
- Share of female teachers Reliability: Moderate reliability.
- 81%
- Teacher turnover Reliability: Moderate reliability.
- 10%
Moderate reliability — Personnel fields from Skolverket's annual Personal report (1-2 year data lag).
Source: Skolverket · Last updated: 5 Jul 2026
School environment
Safety & Inspection
No active casesRecently inspected
Safety & Inspection
No active cases
Recently inspected
No open remarks from the Schools Inspectorate.
- Open remarks Reliability: High reliability.
- 0
School Survey — all perspectives
| Dimension | Pupils (åk 8) | Guardian | Staff |
|---|---|---|---|
| Safety | 7.4 / 10 | — | — |
| Study environment | 5.1 / 10 | — | — |
| Anti-bullying | 5.1 / 10 | — | — |
| Stimulation | 5.1 / 10 | — | — |
| Support | 6.0 / 10 | — | — |
Scale 0–10 (rescaled from Skolverket's 0–100). Guardian and staff perspectives are often not in open data.
High reliability — Inspection register and Skolenkäten survey.
Source: Schools Inspectorate + Skolverket · Last updated: 5 Jul 2026
Resources
145,070 SEKCost per pupil (total)Sweden: 144,179 SEK
Resources
145,070 SEK
Cost per pupil (total)
Cost per pupil is 1% above the national average.
Limited history — Cost data updated annually by Kolada/SCB.
Who runs the school
Operator
MORA KOMMUNMunicipal operator47 other schools in the municipality.
Operator
MORA KOMMUN
Municipal operator

MORA KOMMUN is the operator. The municipality has 47 other schools.
- Operator Reliability: High reliability.
- MORA KOMMUN
- Operating form Reliability: High reliability.
- Municipal own operation
- Other schools in municipality Reliability: High reliability.
- 47
High reliability — Current data from Skolverket and Bolagsverket.
Source: Skolverket · Last updated: 5 Jul 2026
Contact and address
- Headmaster
- Cecilia Grudd
- Visiting address
- Norebergsvägen 40, 79250 Mora
- Postal address
- 79280 MORA
- Phone
- 0250-26374
- Website
- www.mora.se/
- School unit code
52614244
Source: Skolverket School Unit Register · Pipeline-fetched on 2026-07-05.
Everyday travelAreas that reach the school within 15 minutes.
Reachability from the school
15 min on foot
15 min by bike
School
Support and inclusion
Support and student health
This panel shows sourced support-resource data where available and marks the rest as missing or uncertain. These fields do not affect score or ranking.
Missing or uncertain support-resource fields
- MissingStudent health teamIs there sourced information about student health functions at the school?
- PartialSpecial educatorThe source does not split special educators and special needs teachers per school unit in this model.
- PartialSpecial needs teacherThe source does not split special educators and special needs teachers per school unit in this model.
- MissingSchool nurseIs there sourced information about school nurse resources?
- MissingPsychologistIs there sourced information about psychologist resources?
- MissingStudy and career guidanceIs there sourced information about study and career guidance?
- MissingLanguage supportIs there sourced information about language or mother-tongue support?
- MissingAdaptations and special supportIs there verified process information for adaptations and special support?
- MissingAccessibilityIs there sourced information about physical or pedagogical accessibility?
- MissingContact routeIs there a verified contact route for support questions?
Privacy rule: no individual pupil health, diagnosis, support decision or personal case data may be stored.
Nearest and similar schools
About Mora municipality
School-form averages across the municipality, with links to deep-dive sub-pages.
- Schools
- 48
- Avg. merit (yr 9)
- 209.1−18.6
- Certified teachers
- 72%in line
- Pupils per teacher
- 9.7−2.3
Source: Skolverket (aggregated school statistics).
★ Watch Noretsskolan
Get email when new statistics are published, merit value changes significantly or the School Inspectorate makes a new decision.
Want to dig deeper?
The Data view shows complete history, sources, methodology and CSV export.
In-depth metrics
Staff stability
Improving
Source: Kolada (municipality-aggregated certified teacher trend).
Explore further
More context about Noretsskolan, its municipality, operator and similar schools.
Schools in MoraOpen the municipality page with all schools, rankings, and local aggregates.Mora kommunSee all schools, municipalities, and core metrics for the same provider.Dalarnas länCompare municipalities and school patterns across the whole county.Compare schoolsBuild a side-by-side comparison with the schools you care about.
Data coverage
What we do not know about Noretsskolan
Open school data is not complete. Use this as a checklist for what to verify with the school, provider or municipality.
- MissingResults and score inputsSkolkoll score is not shown for this school type or lacks enough underlying data.
- MissingEligibility and goal attainmentGrades, eligibility and goal-attainment data may be missing, suppressed or available only for some grades and school types.
- UncertainResources, teachers and staffTeacher and resource metrics do not always show subject mix, vacancies, student-health workflows or everyday staffing.
- PartialSupport resources and student healthSome support-resource fields have sourced statistics, but several parts are still missing or reported only in aggregate.
- MissingSafety and study environmentWe lack current or displayable survey data about safety and study environment for this school.
- UncertainAdmissions, placement and important datesMunicipal placement rules, queues and important dates require a local source and should be checked with the municipality or school.
- MissingVisits, facilities and everyday environmentWe lack sourced open-house information for this school. Facilities, accessibility and everyday environment are often not open comparable data.
See Data view for full sources and fetch dates per source.