below the national midpointShows where a school sits within a comparison group. Percentile 80 means the school ranks above roughly 80 percent of that group.Compared to all upper-secondary schools nationally
0median100
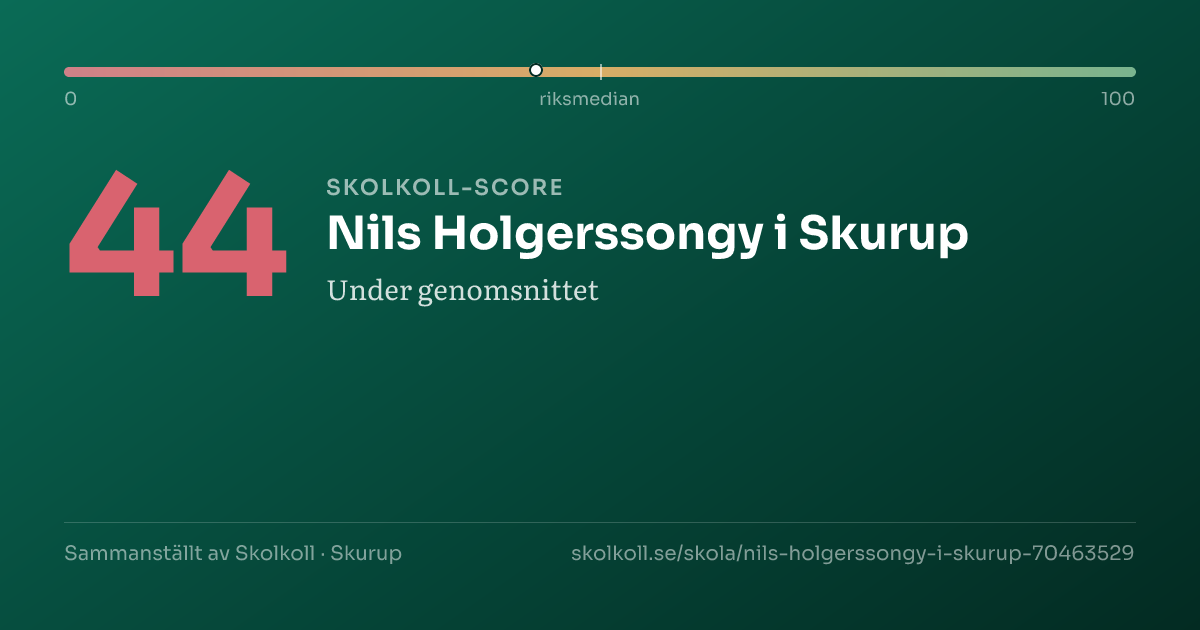
Skolkoll Score 44 out of 100. The scale goes from 0 (lowest) to 100 (highest). 50 is the average. Better than 44% of Sweden’s upper secondary schools.
A composite of five open data sources — a starting point, not a grade.
Data coverageMedium3/5
Why this score?
Skolkoll score is Skolkoll's composite indicator based on available data sources. It is not an official quality measure and should be read together with the underlying data.
3 of 5 score dimensions have school-specific data.
When school-specific data is missing for a dimension, the neutral value 50 is used. That does not automatically lower the school, but it makes the score less informative.
Nils Holgerssongy i Skurup is a medium-sized municipal upper secondary school with 260 pupils.
Nils Holgerssongy i Skurup is a medium-sized municipal upper secondary school with 260 pupils. The share of qualified teachers (61%) is below the national average of 78%.
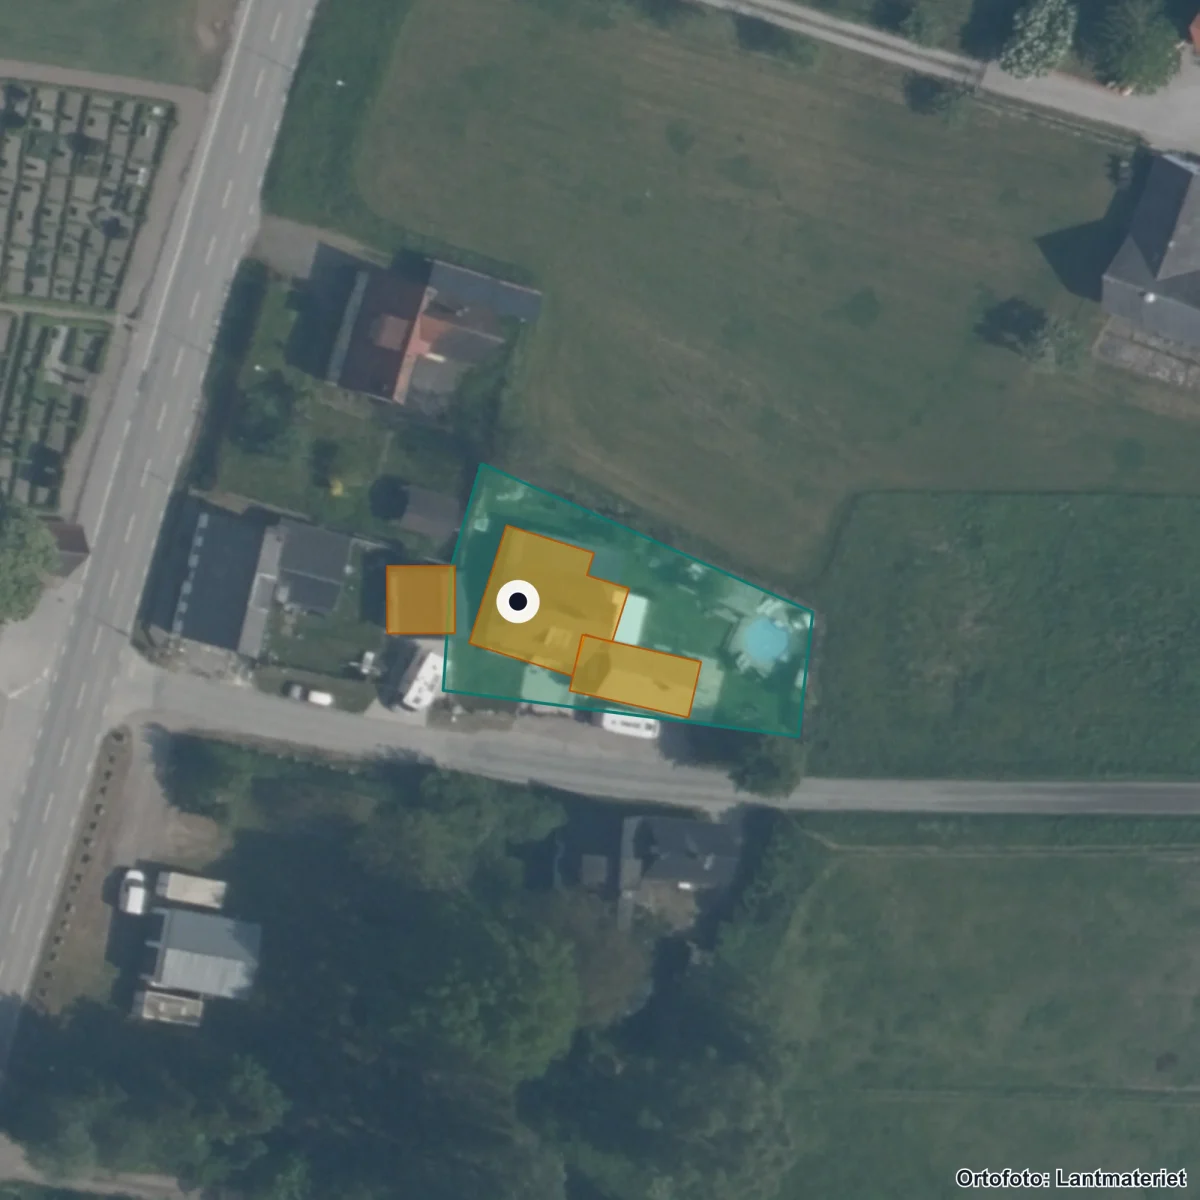
Aerial view of the school's surroundings. The property is marked from the register; building use has not been verified. Updated 2026.Source: Lantmäteriet · CC BY 4.0
Skurup, Västra Vemmenhög 108, Skurup·Schoolyard: approx. 400 m²
Entrances:1 Skurup, Västra Vemmenhög 108, Skurup
School performance
Results
›
13.4
Avg. graduation grade
Sweden: 13.8
Average graduation grade is 0.4 points below the national average.
Lowest admitted merit score from latest admission round. Smaller programmes (under 20 places) have larger year-to-year variation.
After graduation (3 years)
Outcome
Share
Established in the labor market (vocational programmes)
73.7%
Source: Skolverket Statistikdatabasen (per school unit, 3 years after graduation). Rows are independent outcome metrics and do not sum to 100%. One-year follow-up and a university-vs-other-studies split are not published in open data per school.
◐Moderate reliability — Mixed sources: results reported directly by the school operator; post-graduation outcomes (3 years) from Skolverket Statistikdatabasen.
What we do not know about Nils Holgerssongy i Skurup
Open school data is not complete. Use this as a checklist for what to verify with the school, provider or municipality.
MediumResults and score inputsMedium data coverage: 3 of 5 score dimensions have school-specific data. When school-specific data is missing for a dimension, the neutral value 50 is used. That does not automatically lower the school, but it makes the score less informative.
MediumEligibility and goal attainmentGrades, eligibility and goal-attainment data may be missing, suppressed or available only for some grades and school types.
UncertainResources, teachers and staffTeacher and resource metrics do not always show subject mix, vacancies, student-health workflows or everyday staffing.
MissingSupport resources and student healthWe do not yet have a verified national data source for special education, student health, adaptations, language support or contact routes per school.
MissingSafety and study environmentWe lack current or displayable survey data about safety and study environment for this school.
PartialAdmissions, placement and important datesAdmission data is available for upper-secondary programmes where sources publish it, but it is historical and not a forecast.
MissingVisits, facilities and everyday environmentWe lack sourced open-house information for this school. Facilities, accessibility and everyday environment are often not open comparable data.
Places, admission and support are decided by the school, provider or municipality. Use this as a checklist, not a promise of outcome.
For the school: get your Skolkoll badge
Work at this school? Embed an image showing the school's Skolkoll score that links to the full profile. The image is served from Skolkoll's image host and updates when we publish a new badge for the school.
<a href="https://skolkoll.se/en/school/nils-holgerssongy-i-skurup-70463529/" title="Nils Holgerssongy i Skurup on Skolkoll" target="_blank" rel="noopener"><img src="https://images.skolkoll.se/objects/score-badges/current/skola/nils-holgerssongy-i-skurup-70463529.png" alt="Skolkoll score for Nils Holgerssongy i Skurup" width="1200" height="630" style="width:100%;max-width:600px;height:auto;border:0;border-radius:8px" loading="lazy"></a>
See Data view for full sources and fetch dates per source.
Data sources: Skolverket, Kolada (RKA/SKR), SCB · Updated 2026-07-05
Method
About this value
Cookie settings
We use cookies for visitor statistics, A/B testing and site improvement (Google Analytics 4 with IP anonymization and Zoho PageSense, which may include heatmaps and session recording on public pages). Skolkoll does not sell visitor data and shows no advertising. Read more in our privacy policy