MONTESSIRFÖRSKOLAN SKEPPET is a small independent preschool with 35 children.
MONTESSIRFÖRSKOLAN SKEPPET is a small independent preschool with 35 children. The share of staff with pedagogical higher education (13.8%) is below the national average of 43.6%.
- 35ChildrenMunicipality: 2,044High reliability
- 13.8%Share with pedagogical higher educationMunicipality: 32.9% · Sweden: 43.6%High reliability
- 4.8Children per staff memberMunicipality: 5.6 · Sweden: 5.1High reliability
The most important facts in 3 points
- Preschool in Lidingö with 35 enrolled children.
- Preschools are not covered by our inspection sync; check the Inspectorate or municipality if needed.
- Applying? Go to the school's application link on this page.
Skolkoll interpretation
MONTESSIRFÖRSKOLAN SKEPPET is compared here with 42 other schools with the same school form in Lidingö municipality; it has 35 children versus the municipal average of 51.
Share with pedagogical higher education: 13.8%, 19.1 percentage points below the municipal average and 29.8 percentage points below the national average.
Children per staff member is 4.8, 0.8 lower than the municipal average.
Apply for a place? Use Lidingö e-service for preschool application (opens in a new window).
School programmes
- Montessori
Things to look into
Worth looking into. These indicators are an attention aid, not a quality grade or risk score.
- 13.8% of staff have pedagogical higher education — below the national average (43.6%).
Aerial view of the school
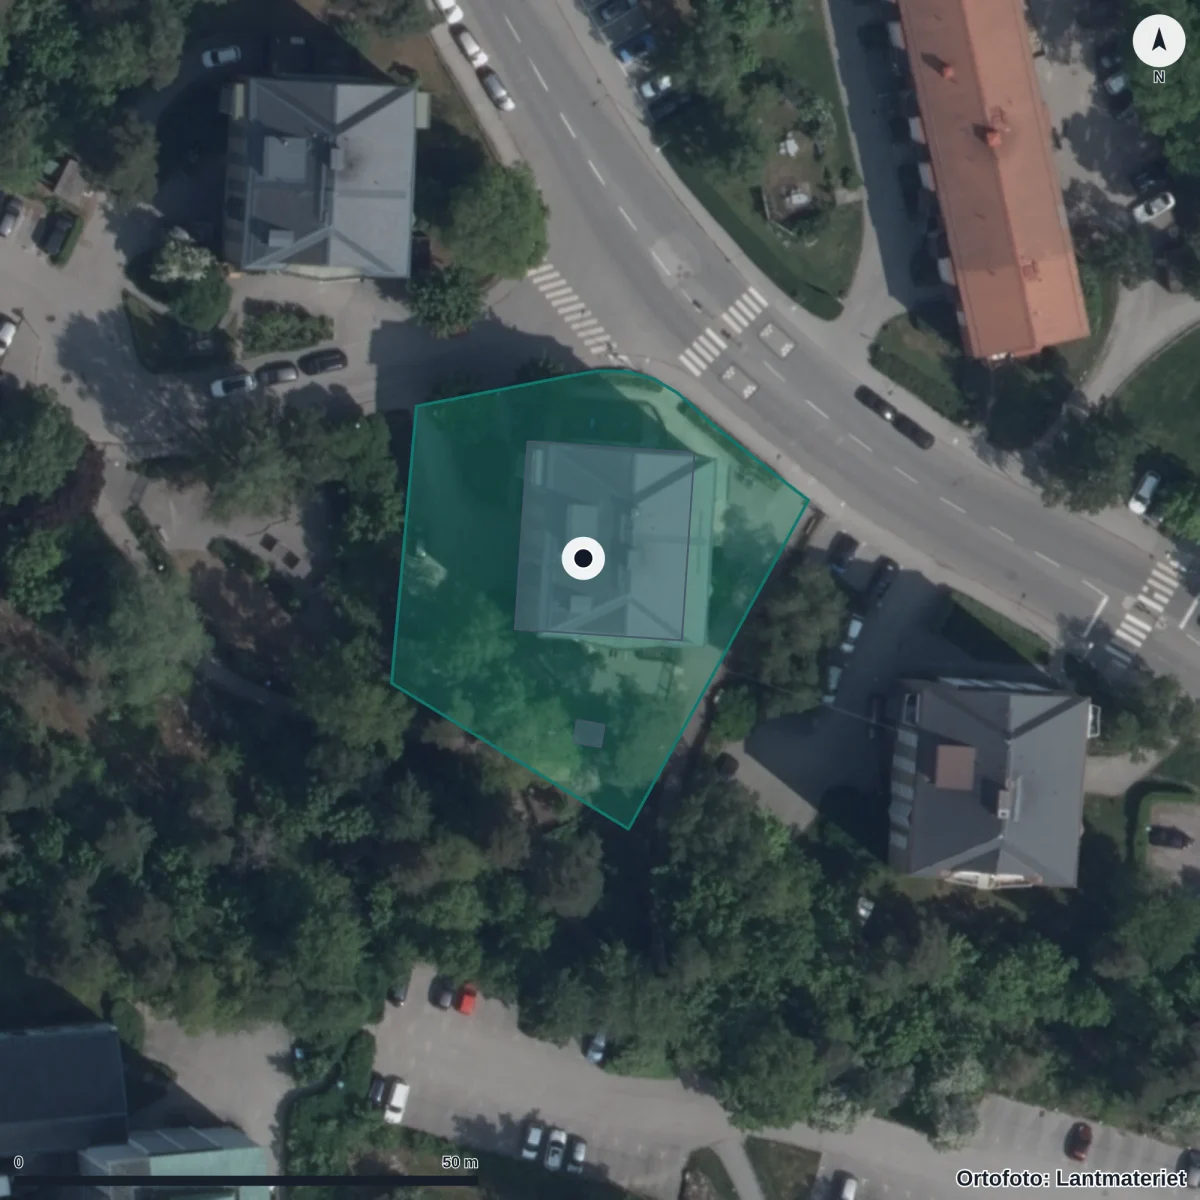
Aerial view of the school's surroundings. The property is marked from the register; building use has not been verified. Updated 2026. Source: Lantmäteriet · CC BY 4.0
Entrances:1 Lidingö, Bodalsvägen 12, Lidingö
School performance
Staff
13.8%Share with pedagogical higher educationMunicipality: 32.9% · Sweden: 43.6%
Staff
13.8%
Share with pedagogical higher education
School environment
Safety & Inspection
No active casesRecently inspected
Safety & Inspection
No active cases
Recently inspected
No open remarks from the Schools Inspectorate.
- Open remarks Reliability: High reliability.
- 0
High reliability — Inspection register and Skolenkäten survey.
Source: Schools Inspectorate + Skolverket · Last updated: 5 Jul 2026
Who runs the school
Operator
MONTESSORIFÖRSKOLAN SKEPPET EKONOMISK FÖRENINGIndependent operator68 other schools in the municipality.
Operator
MONTESSORIFÖRSKOLAN SKEPPET EKONOMISK FÖRENING
Independent operator
MONTESSORIFÖRSKOLAN SKEPPET EKONOMISK FÖRENING operates this school independently.
- Operator Reliability: High reliability.
- MONTESSORIFÖRSKOLAN SKEPPET EKONOMISK FÖRENING
- Operating form Reliability: High reliability.
- Independent
- Other schools in municipality Reliability: High reliability.
- 68
High reliability — Current data from Skolverket and Bolagsverket.
Source: Skolverket · Last updated: 5 Jul 2026
Next step: Apply for a place
Apply through Lidingö e-service for preschool application.
Contact and address
- Visiting address
- BODALSVÄGEN 12, 18136 LIDINGÖ
- Postal address
- Bodalsvägen 12, 18136 LIDINGÖ
- School unit code
forsk-191791
Source: Skolverket School Unit Register · Pipeline-fetched on 2026-07-05.
Everyday travelAreas that reach the school within 15 minutes.
Reachability from the school
15 min on foot
15 min by bike
School
Daily-life profile
Everyday life at the school
Everyday facts are shown with a source where available. Fields not yet collected are listed together and do not affect score or ranking.
Not collected yet: School day times, After-school care, Profile or focus, Language choices, Food and dining, Facilities and outdoor environment, Homework and study support. Suggest an addition →
Nearest and similar schools
- ABBORRVÄGENS FÖRSKOLASame municipality· 57 children
- BAGGEBY GÅRDS FÖRSKOLASame municipality· 60 children
- BLÅKULLA FÖRÄLDRAKOOPERATIVSame municipality· 30 children

About Lidingö municipality
School-form averages across the municipality, with links to deep-dive sub-pages.
- Schools
- 69
- Avg. merit (yr 9)
- 258.1+30.4
- Certified teachers
- 76%in line
- Pupils per teacher
- 13.3+1.3
Source: Skolverket (aggregated school statistics).
★ Watch Montessirförskolan Skeppet
Get email when new statistics are published, merit value changes significantly or the School Inspectorate makes a new decision.
Want to dig deeper?
The Data view shows complete history, sources, methodology and CSV export.
In-depth metrics
Staff stability
Improving
Source: Kolada (municipality-aggregated certified teacher trend).
Preschool statistics
Key figures for MONTESSIRFÖRSKOLAN SKEPPET. Compared to municipal and national averages.
Pedagogical profile:
- Montessori
Staff educational background (2025)
Skolverket's mutually exclusive categories for staff in the preschool unit.
| Category | This preschool | Municipality | National |
|---|---|---|---|
| Pedagogical higher educationpreschool teachers and others with a Swedish higher-education degree | 14% | 32.9% | 43.6% |
| Upper-secondary qualification for work with childrenchildcare assistant training or equivalent | 0% | 5.9% | 15.4% |
| Some pedagogical trainingfor example parts of a pedagogical education | 37% | – | – |
| Other educationother education, including foreign qualifications not validated in Sweden | 49% | – | – |
| Other educational background (combined)comparison row for the two categories that municipal and national statistics publish together | 86% | 61.2% | 40.2% |
Of which preschool-teacher degree: 14%
Municipal preschool data for Lidingö (2025) (5 metrics)
National average calculated from all 290 municipalities. Municipal data is aggregated and applies to all preschools in Lidingö. Source: Skolverket preschool statistics. Updated annually.
Explore further
More context about Montessirförskolan Skeppet, its municipality, operator and similar schools.
Preschools in LidingöSee all preschools in the municipality with key metrics.Schools in LidingöOpen the municipality page with all schools, rankings, and local aggregates.Montessoriförskolan Skeppet Ekonomisk FöreningSee all schools, municipalities, and core metrics for the same provider.Stockholms länCompare municipalities and school patterns across the whole county.School size by school typeSee how school forms and unit sizes are distributed nationally.School type distributionCompare how school forms are distributed across municipalities and operators.Compare schoolsBuild a side-by-side comparison with the schools you care about.
Data coverage
What we do not know about Montessirförskolan Skeppet
Open school data is not complete. Use this as a checklist for what to verify with the school, provider or municipality.
- MissingResults and score inputsSkolkoll score is not shown for this school type or lacks enough underlying data.
- MissingEligibility and goal attainmentGrades, eligibility and goal-attainment data may be missing, suppressed or available only for some grades and school types.
- UncertainResources, teachers and staffTeacher and resource metrics do not always show subject mix, vacancies, student-health workflows or everyday staffing.
- MissingSupport resources and student healthWe do not yet have a verified national data source for special education, student health, adaptations, language support or contact routes per school.
- MissingSafety and study environmentWe lack current or displayable survey data about safety and study environment for this school.
- UncertainAdmissions, placement and important datesMunicipal placement rules, queues and important dates require a local source and should be checked with the municipality or school.
- MissingVisits, facilities and everyday environmentWe lack sourced open-house information for this school. Facilities, accessibility and everyday environment are often not open comparable data.
See Data view for full sources and fetch dates per source.