
Staff stability
Improving
Source: Kolada (municipality-aggregated certified teacher trend).
Headmaster: Anders Digné
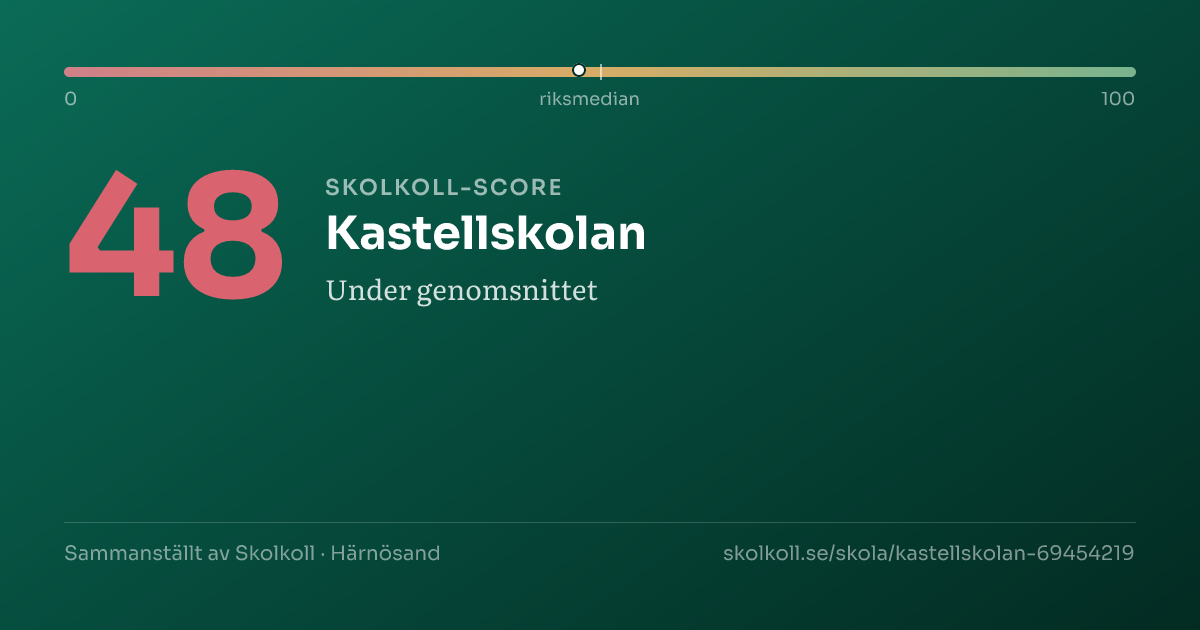
A composite of five open data sources — a starting point, not a grade.
The score reflects results directly. Given the pupil intake, the school still performs in line with expectations — see value-added.
Skolkoll score is Skolkoll's composite indicator based on available data sources. It is not an official quality measure and should be read together with the underlying data.
4 of 5 score dimensions have school-specific data.
When school-specific data is missing for a dimension, the neutral value 50 is used. That does not automatically lower the school, but it makes the score less informative.
Results in line with the pupil intakeA statistical model that compares schools’ results with what is expected given the student composition.Read more in glossary →What is value-added?The school's own contribution given its pupil intake (Skolverket's SALSA model) — not a quality guarantee, and not comparable between years.

Kastellskolan is a medium-sized independent compulsory school with 230 pupils.
Kastellskolan is a medium-sized independent compulsory school with 230 pupils. The share of qualified teachers (62%) is below the national average of 72%.
See how schools in Härnösand rank →
Kastellskolan is compared here with 13 other schools with the same school form in Härnösand municipality; it has 230 pupils versus the municipal average of 176.
The year-9 merit value is 231.2, 13.8 points above the municipal average and 3.5 points above the national average.
Qualified teachers: 62%, 9 percentage points below the municipal average and 10 percentage points below the national average.
Pupils per teacher is 11.1, 0.2 higher than the municipal average.
Apply for a place? Use Härnösand e-service for school choice (opens in a new window).
This applies only to the values listed here.
This value is missing in full or in part.
This affects
Other values here do not have this specific note.
Worth looking into. These indicators are an attention aid, not a quality grade or risk score.
The school's strengths compared with all primary schools nationally.
Source: Skolverket, Swedish Schools Inspectorate.
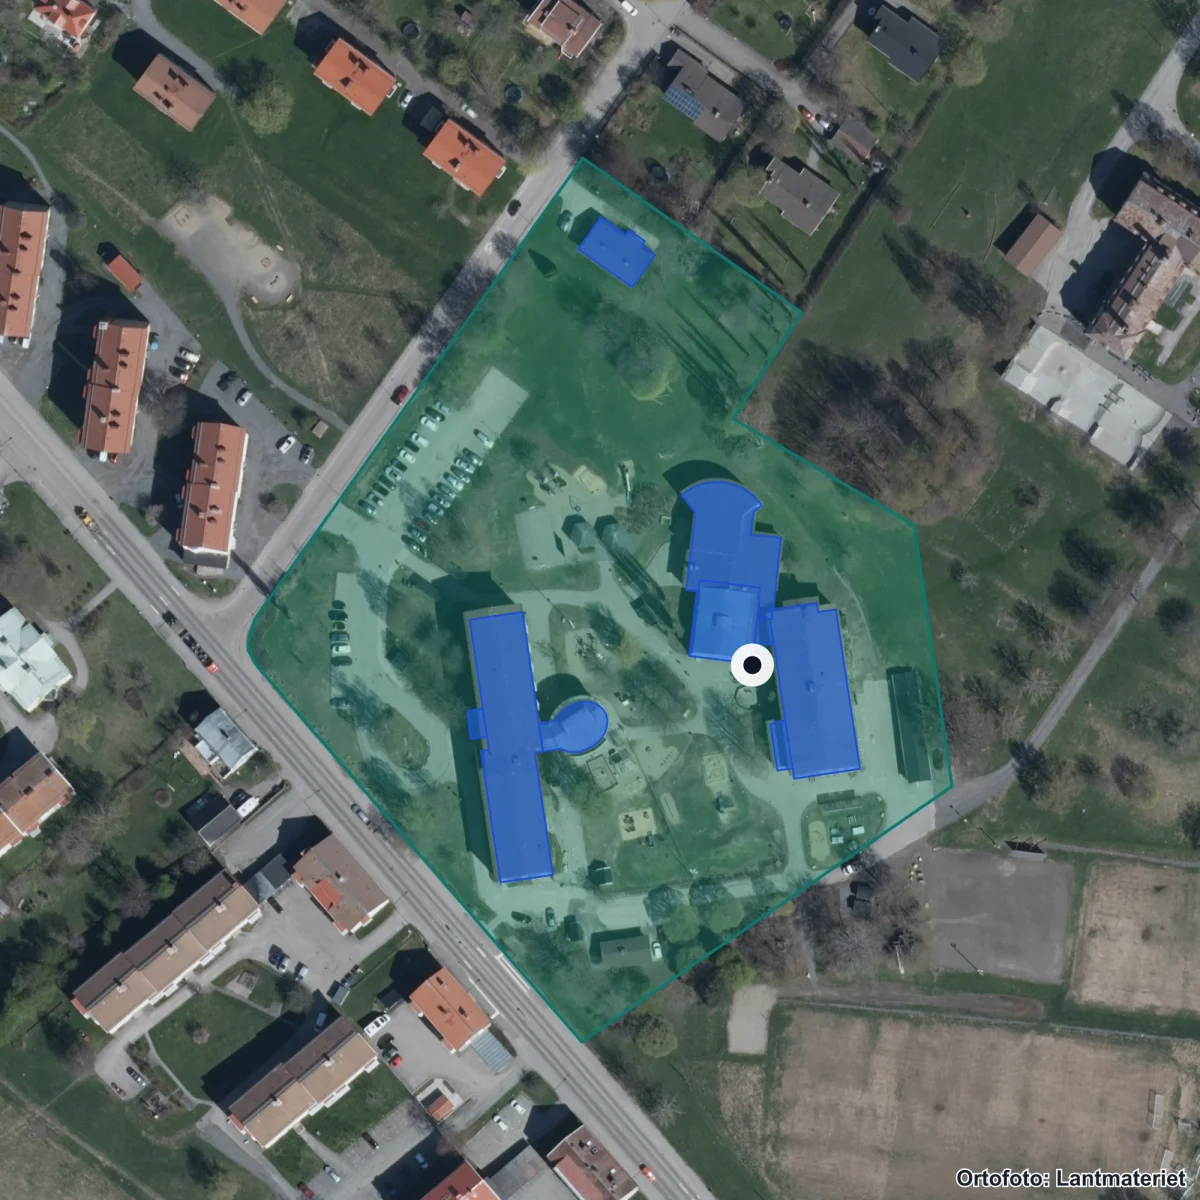
The school's property boundary and buildings from the Swedish Land Survey's property register. Updated 2026. Source: Lantmäteriet · CC BY 4.0
Entrances:1 Härnösand, Hovsgatan 19, Härnösand
Sweden: 227.7
Municipality: 71% · Sweden: 72%
62% of teachers hold a pedagogical degree — 11 percentage points below the national average.
Model prediction: 231.0 · Actual outcome: 230.0
The school performs above what the student composition would predict.
Safety index: 65 / 100
1 open remark(s) from the Schools Inspectorate.
| Dimension | Pupils (åk 8) | Guardian | Staff |
|---|---|---|---|
| Safety | 7.5 / 10 | — | — |
| Study environment | 5.7 / 10 | — | — |
| Anti-bullying | 5.6 / 10 | — | — |
| Stimulation | 5.9 / 10 | — | — |
| Support | 6.7 / 10 | — | — |
Scale 0–10 (rescaled from Skolverket's 0–100). Guardian and staff perspectives are often not in open data.
Source: Schools Inspectorate + Skolverket · Last updated: 5 Jul 2026
Sweden: 144,179 SEK
Cost per pupil is 8% above the national average.
46 other schools in the municipality.
KASTELLSKOLAN operates this school independently.
Source: Skolverket · Last updated: 5 Jul 2026
Apply through Härnösand e-service for school choice.
69454219Source: Skolverket School Unit Register · Pipeline-fetched on 2026-07-05.
Everyday travelAreas that reach the school within 15 minutes.
School-form averages across the municipality, with links to deep-dive sub-pages.
Source: Skolverket (aggregated school statistics).
The 5 most-similar compulsory schools based on student count, geography, teacher certification and pupil composition.
Share of pupils per grade, school year 2024/25.
Source: SIRIS/Skolverket · See full A–F distribution in the data view →
SALSA is a statistical comparison metric, not a school rating. Small cohorts and individual year groups can create uncertain signals, so read it together with pupil counts, survey data and other sources.
Source: Skolverket/SALSA · See the full comparison table →
Number of pupils per year group (total 225 pupils). Latest available year from Skolverket (SIRIS).
Get email when new statistics are published, merit value changes significantly or the School Inspectorate makes a new decision.
The Data view shows complete history, sources, methodology and CSV export.
Source: Kolada (municipality-aggregated certified teacher trend).
Source: Skolverket SIRIS + Skolverket Statistical Database.
The school survey shows pupil experience where responses are available. Read values together with year, response coverage and unknowns.
Coverage: 2 displayed year groups · year 2026.
Support-needs policy · School-choice guide
Source: Skolinspektionen Skolenkäten 2026. Updated annually. · See all years and dimensions in the data view →
Weekly menus and meal provider for this school's municipality.
No menu provider registered for this municipality yet.
Source: municipality's own meal portal — Skolkoll does not host menu content.
Source: Skolinspektionen tillsynsregister (open data). Updated when new decisions are published. · See all decisions and review types in the data view → · Check current status at the Schools Inspectorate ↗
More context about Kastellskolan, its municipality, operator and similar schools.
Data coverage
Open school data is not complete. Use this as a checklist for what to verify with the school, provider or municipality.
Work at this school? Embed an image showing the school's Skolkoll score that links to the full profile. The image is served from Skolkoll's image host and updates when we publish a new badge for the school.
See Data view for full sources and fetch dates per source.