Staff stability
Improving
Source: Kolada (municipality-aggregated certified teacher trend).
Headmaster: Marion Patron
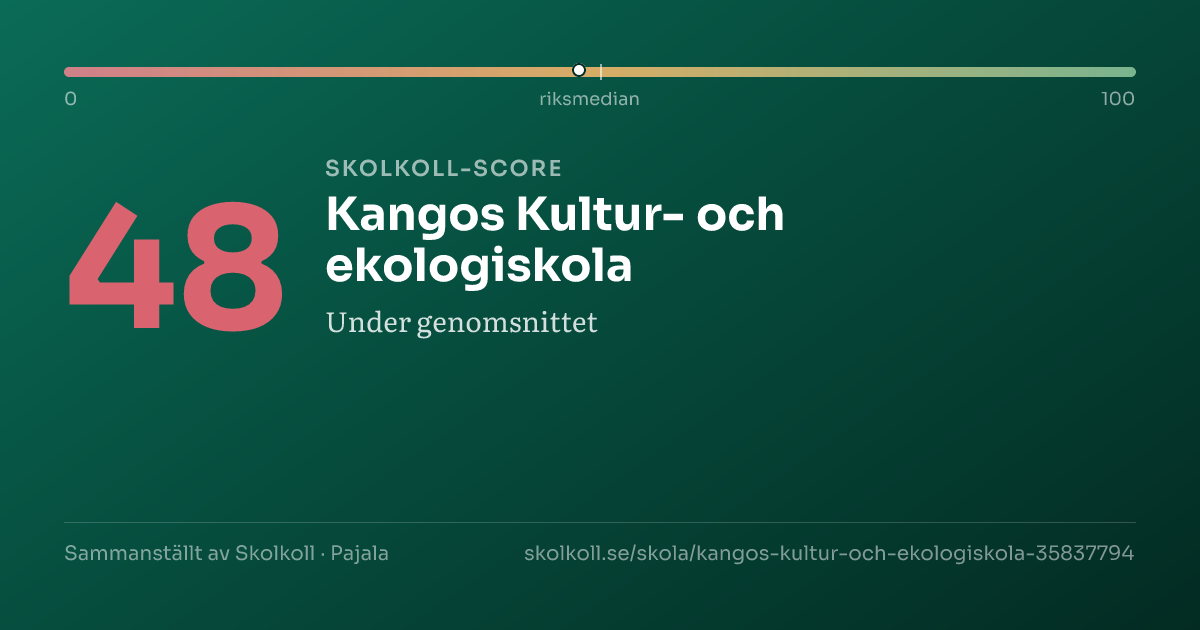
A composite of five open data sources — a starting point, not a grade.
Skolkoll score is Skolkoll's composite indicator based on available data sources. It is not an official quality measure and should be read together with the underlying data.
3 of 5 score dimensions have school-specific data.
When school-specific data is missing for a dimension, the neutral value 50 is used. That does not automatically lower the school, but it makes the score less informative.
Kangos Kultur- och ekologiskola is a small independent compulsory school with 50 pupils.
Kangos Kultur- och ekologiskola is a small independent compulsory school with 50 pupils. The share of qualified teachers (45%) is below the national average of 72%.
See how schools in Pajala rank →
Kangos Kultur- och ekologiskola is compared here with 5 other schools with the same school form in Pajala municipality; it has 50 pupils versus the municipal average of 85.
Qualified teachers: 45%, 10 percentage points below the municipal average and 27 percentage points below the national average.
Pupils per teacher is 6.5, 1.8 lower than the municipal average.
Apply for a place? Use Pajala e-service for school choice (opens in a new window).
This applies only to the values listed here.
This value is missing in full or in part.
This affects
Other values here do not have this specific note.
Worth looking into. These indicators are an attention aid, not a quality grade or risk score.
The school's strengths compared with all primary schools nationally.
Source: Skolverket, Swedish Schools Inspectorate.
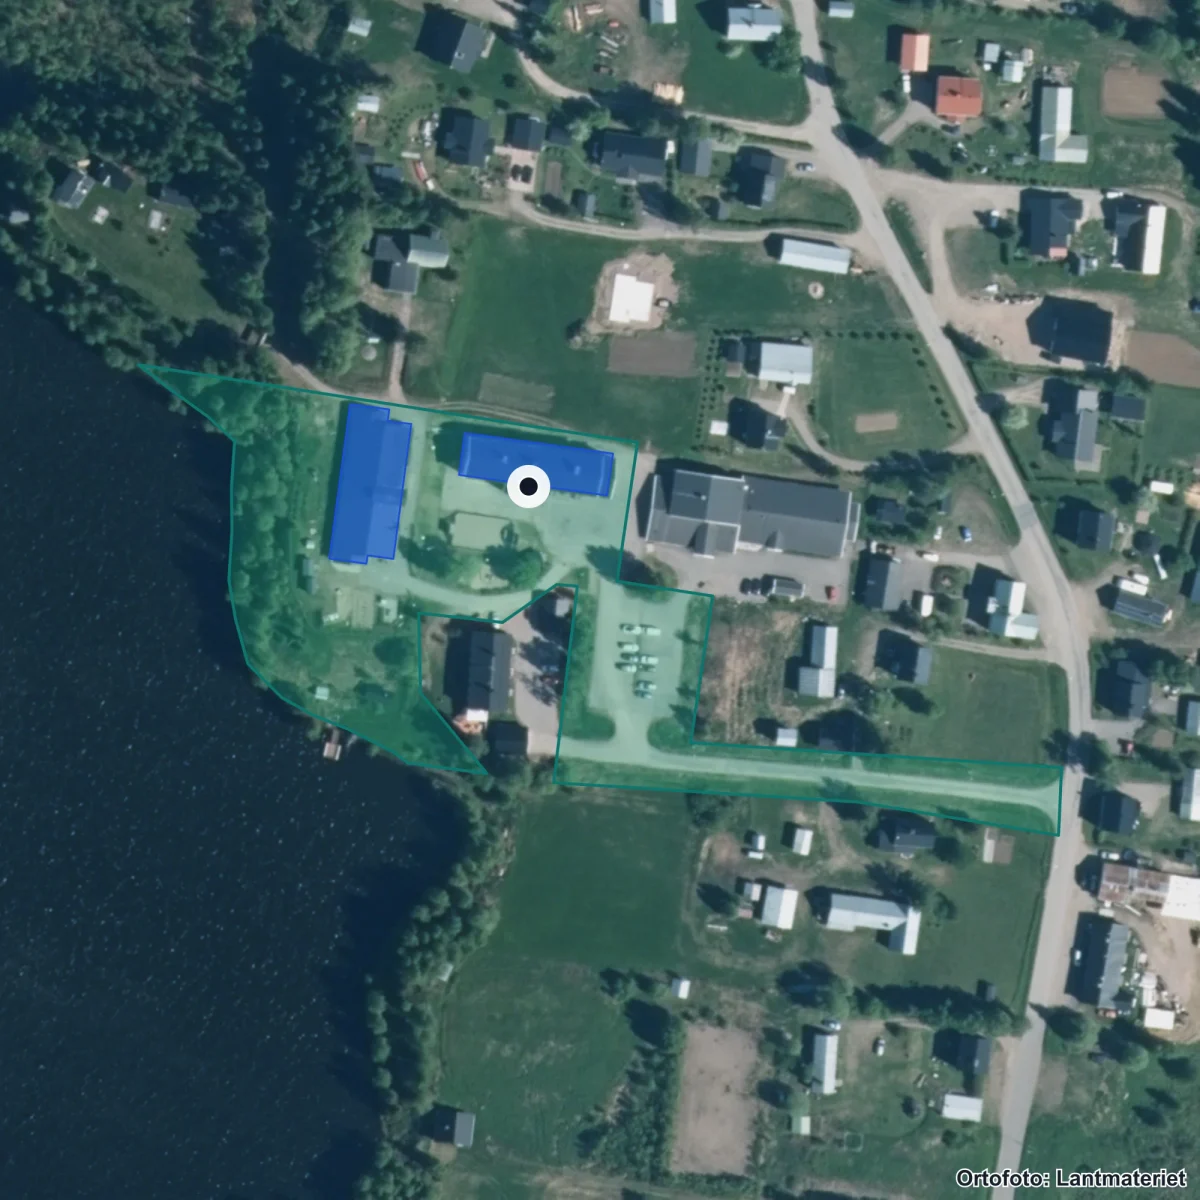
The school's property boundary and buildings from the Swedish Land Survey's property register. Updated 2026. Source: Lantmäteriet · CC BY 4.0
Entrances:1 Pajala, Skolvägen 10, Kangos
Municipality: 55% · Sweden: 72%
45% of teachers hold a pedagogical degree — 27 percentage points below the national average.
Safety index: 83 / 100
No open remarks from the Schools Inspectorate. Latest decision: Regelb. tillsyn Skolbeslut Pajala Kangos Kultur- o ekologiskola, 2014 (pdf, 1419 kB).
Source: Schools Inspectorate + Skolverket · Last updated: 5 Jul 2026
Sweden: 144,179 SEK
Cost per pupil is 40% above the national average.
17 other schools in the municipality.
KANGOS KULTUR OCH EKOLOGISKOLA operates this school independently.
Source: Skolverket · Last updated: 5 Jul 2026
Apply through Pajala e-service for school choice.
35837794Source: Skolverket School Unit Register · Pipeline-fetched on 2026-07-05.
Everyday travelAreas that reach the school within 15 minutes.
School-form averages across the municipality, with links to deep-dive sub-pages.
Source: Skolverket (aggregated school statistics).
The 5 most-similar compulsory schools based on student count, geography, teacher certification and pupil composition.
Number of pupils per year group (total 48 pupils). Latest available year from Skolverket (SIRIS).
Get email when new statistics are published, merit value changes significantly or the School Inspectorate makes a new decision.
The Data view shows complete history, sources, methodology and CSV export.
Source: Kolada (municipality-aggregated certified teacher trend).
Weekly menus and meal provider for this school's municipality.
No menu provider registered for this municipality yet.
Source: municipality's own meal portal — Skolkoll does not host menu content.
The Schools Inspectorate has 4 decisions on record without critical findings. Most recent: Dec 2014.
Source: Skolinspektionen tillsynsregister (open data). Updated when new decisions are published. · See all decisions and review types in the data view → · Check current status at the Schools Inspectorate ↗
More context about Kangos Kultur- och ekologiskola, its municipality, operator and similar schools.
Data coverage
Open school data is not complete. Use this as a checklist for what to verify with the school, provider or municipality.
Work at this school? Embed an image showing the school's Skolkoll score that links to the full profile. The image is served from Skolkoll's image host and updates when we publish a new badge for the school.
See Data view for full sources and fetch dates per source.