
Staff stability
Declining
Source: Kolada (municipality-aggregated certified teacher trend).
Hulebäcksgymnasiet is a large municipal upper secondary school with 460 pupils.
Hulebäcksgymnasiet is a large municipal upper secondary school with 460 pupils. The share of qualified teachers (98%) is above the national average of 78%.
Hulebäcksgymnasiet is compared here with 7 other schools with the same school form in Härryda municipality; it has 460 pupils versus the municipal average of 287.
The average graduation grade is 12.8, 1.1 points below the municipal average and 1.0 point below the national average.
Qualified teachers: 98%, 13 percentage points above the municipal average and 20 percentage points above the national average.
Pupils per teacher is 17.1, 3.4 higher than the municipal average.
This applies only to the values listed here.
There is still too little history to interpret the trend safely.
This affects
Other values here do not have this specific note.
Worth looking into. These indicators are an attention aid, not a quality grade or risk score.
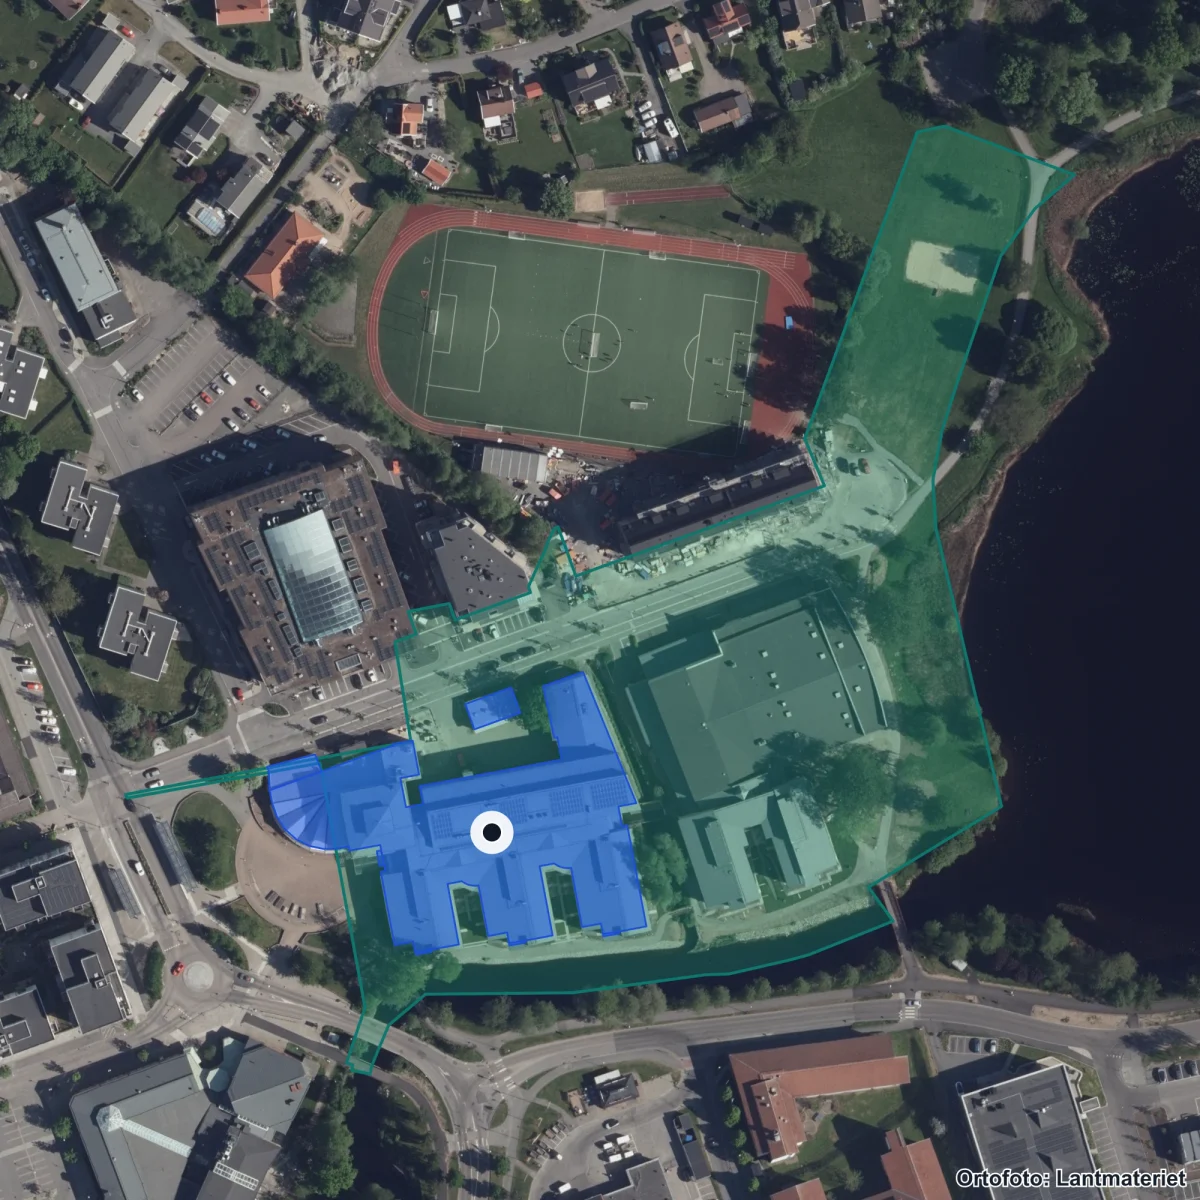
The school's property boundary and buildings from the Swedish Land Survey's property register. Updated 2026. Source: Lantmäteriet · CC BY 4.0
Entrances:1 Härryda, Idrottsgatan 2, Mölnlycke
Sweden: 13.8
Average graduation grade is 1.0 points below the national average.
| Outcome | Share |
|---|---|
| Studying in higher education | 62.3% |
| Established in the labor market (vocational programmes) | 28.6% |
Source: Skolverket Statistikdatabasen (per school unit, 3 years after graduation). Rows are independent outcome metrics and do not sum to 100%. One-year follow-up and a university-vs-other-studies split are not published in open data per school.
Municipality: 85% · Sweden: 78%
98% of teachers hold a pedagogical degree — 20 percentage points above the national average.
No open remarks from the Schools Inspectorate. Latest decision: Regelb. tillsyn Skolbeslut Härryda Hulebäcksgymnasiet 5, 2014 (pdf, 579 kB).
| Dimension | Pupils (gy 2) | Guardian | Staff |
|---|---|---|---|
| Safety | 8.7 / 10 | — | — |
| Study environment | 6.6 / 10 | — | — |
| Anti-bullying | 6.5 / 10 | — | — |
| Stimulation | 6.2 / 10 | — | — |
| Support | 7.0 / 10 | — | — |
Scale 0–10 (rescaled from Skolverket's 0–100). Guardian and staff perspectives are often not in open data.
Source: Schools Inspectorate + Skolverket · Last updated: 5 Jul 2026
Sweden: 144,179 SEK
Cost per pupil is 10% below the national average.
76 other schools in the municipality.

HÄRRYDA KOMMUN is the operator. The municipality has 76 other schools.
Source: Skolverket · Last updated: 5 Jul 2026
66861851Source: Skolverket School Unit Register · Pipeline-fetched on 2026-07-05.
Everyday travelAreas that reach the school within 15 minutes.
School-form averages across the municipality, with links to deep-dive sub-pages.
Source: Skolverket (aggregated school statistics).
The 5 most-similar upper secondary schools based on student count, geography, teacher certification and pupil composition.
Get email when new statistics are published, merit value changes significantly or the School Inspectorate makes a new decision.
The Data view shows complete history, sources, methodology and CSV export.
Source: Kolada (municipality-aggregated certified teacher trend).
The school survey shows pupil experience where responses are available. Read values together with year, response coverage and unknowns.
Coverage: 1 displayed year group · year 2026.
Support-needs policy · School-choice guide
Source: Skolinspektionen Skolenkäten 2026. Updated annually. · See all years and dimensions in the data view →
Weekly menus and meal provider for this school's municipality.
No menu provider registered for this municipality yet.
Source: municipality's own meal portal — Skolkoll does not host menu content.
The Schools Inspectorate has 1 decision on record without critical findings.
Source: Skolinspektionen tillsynsregister (open data). Updated when new decisions are published. · See all decisions and review types in the data view → · Check current status at the Schools Inspectorate ↗
Source: Skolverket (graduation rate within 3 years). Updated annually.
Source: Skolverket (higher-education eligibility).
More context about Hulebäcksgymnasiet, its municipality, operator and similar schools.
Data coverage
Open school data is not complete. Use this as a checklist for what to verify with the school, provider or municipality.
See Data view for full sources and fetch dates per source.