Gottskär Grundskola in Kungsbacka
Headmaster: Malin Hammer
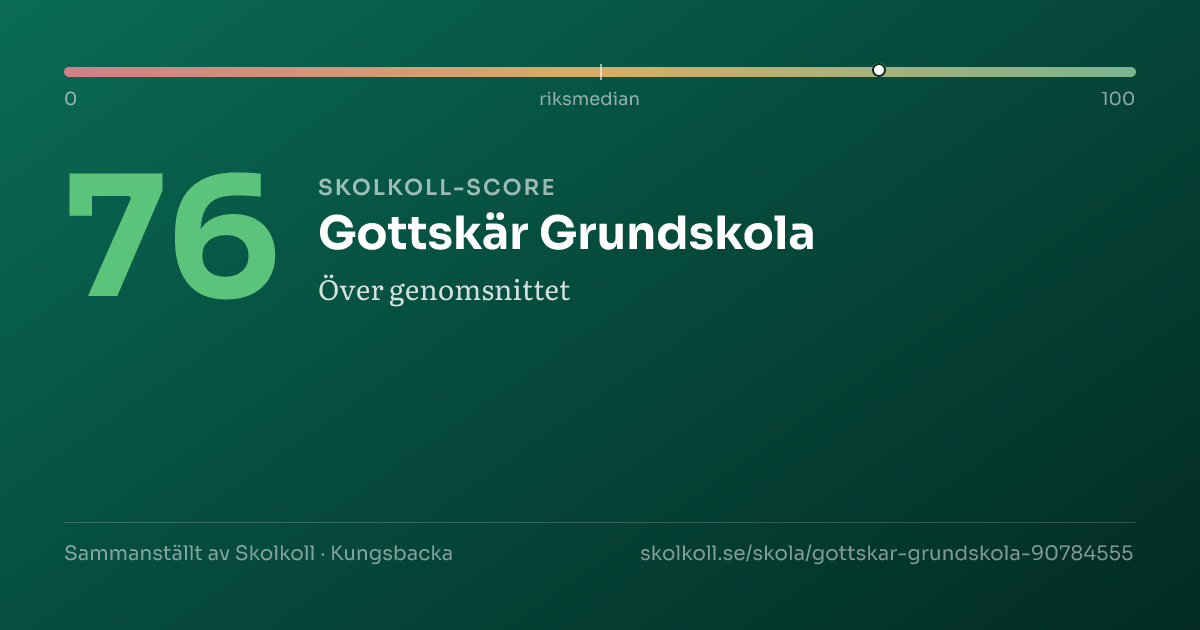
76
Skolkoll Score 76 out of 100. The scale goes from 0 (lowest) to 100 (highest). 50 is the average. Better than 91% of Sweden’s compulsory schools.top 9%Shows where a school sits within a comparison group. Percentile 80 means the school ranks above roughly 80 percent of that group.Compared to all compulsory schools nationally
A composite of five open data sources — a starting point, not a grade.
Data coverageHigh4/5
Why this score?
Skolkoll score is Skolkoll's composite indicator based on available data sources. It is not an official quality measure and should be read together with the underlying data.
4 of 5 score dimensions have school-specific data.
When school-specific data is missing for a dimension, the neutral value 50 is used. That does not automatically lower the school, but it makes the score less informative.
Results in line with the pupil intakeA statistical model that compares schools’ results with what is expected given the student composition.Read more in glossary →What is value-added?The school's own contribution given its pupil intake (Skolverket's SALSA model) — not a quality guarantee, and not comparable between years.
Gottskär Grundskola is a medium-sized independent compulsory school with 200 pupils.
Gottskär Grundskola is a medium-sized independent compulsory school with 200 pupils. The share of qualified teachers (85%) is above the national average of 72%.
- 200PupilsMunicipality: 9,940High reliability
- 85%Qualified teachersMunicipality: 78% · Sweden: 72%High reliability
- 266.6Year 9 merit valueMunicipality: 240.1 · Sweden: 227.7Moderate reliability
- 11.8Pupils per teacherMunicipality: 13.2 · Sweden: 12.0High reliability
- 134,283 SEKCost per pupil (municipal avg.)Sweden: 144,179 SEKLimited history
See how schools in Kungsbacka rank →
The most important facts in 3 points
- Adapted compulsory school in Kungsbacka with 200 pupils.
- The latest inspection (2018) shows an injunction or fine from the Schools Inspectorate.
- Applying? Go to the school's application link on this page.
Skolkoll interpretation
Gottskär Grundskola is compared here with 58 other schools with the same school form in Kungsbacka municipality; it has 200 pupils versus the municipal average of 178.
The year-9 merit value is 266.6, 26.5 points above the municipal average and 38.9 points above the national average.
Qualified teachers: 85%, 7 percentage points above the municipal average and 13 percentage points above the national average.
Pupils per teacher is 11.8, 1.4 lower than the municipal average.
Apply for a place? Use Kungsbacka e-service for school choice (opens in a new window).
Group name and SALSA score need extra caution
This applies only to the values listed here.
This value is missing in full or in part.
This affects
- Group name
- SALSA score
- Annual reports are not real-time data, so group links may lag behind reorganisations or recent ownership changes. Manual overrides are used only as exceptions.
- SALSA is model-based and becomes less stable for small pupil groups or schools with rapidly changing pupil composition.
Other values here do not have this specific note.
School programmes
- Compulsory school
Things to look into
No clear flag.
No clear attention flags from key-figure deviations or the School Inspectorate's public register. Detailed inspection history is shown in the "Safety & Inspection" card below.
School profile
The school's strengths compared with all primary schools nationally.
- Merit ratingP91
- Certified teachersP84
- Pupil-teacher ratioP53
- Eligibility (upper secondary)P86
Source: Skolverket, Swedish Schools Inspectorate.
Aerial view of the school
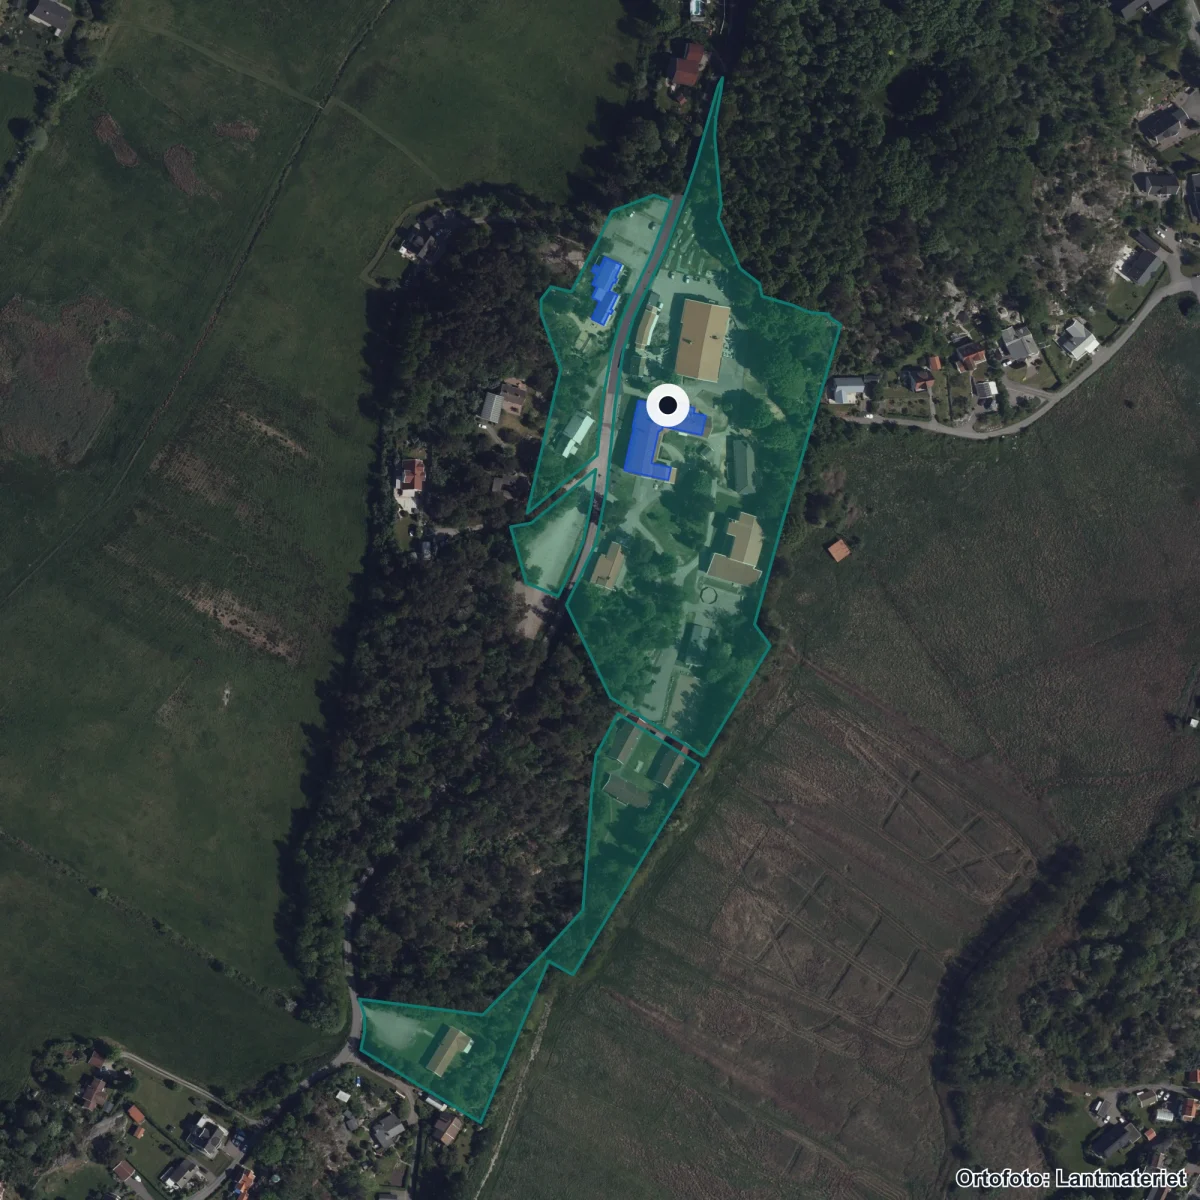
The school's property boundary and buildings from the Swedish Land Survey's property register. Updated 2026. Source: Lantmäteriet · CC BY 4.0
Entrances:1 Kungsbacka, Landstormsvägen 37, Onsala
School performance
Results
266.6Merit value yr 9Sweden: 227.7
Results
266.6
Merit value yr 9
Staff
85%Qualified teachersMunicipality: 78% · Sweden: 72%
Staff
85%
Qualified teachers
85% of teachers hold a pedagogical degree — 13 percentage points above the national average.
- Qualified teachers Reliability: High reliability.
- 85%From 82% (2425) to 85% (2526)Municipality: 78% · Sweden: 72%
- Pupils per teacher Reliability: High reliability.
- 11.8From 13.7 (2425) to 11.8 (2526)Municipality: 13.2 · Sweden: 12.0
- Permanently employed Reliability: Moderate reliability.
- 97%
- Senior teachers (förstelärare) Reliability: Moderate reliability.
- —Data missing — the Swedish National Agency for Education has not published this value.
- Pupils per counsellor Reliability: Moderate reliability.
- 3,760.0
- Certified in their teaching subject Reliability: Moderate reliability.
- 82%
- Teachers (FTE) Reliability: Moderate reliability.
- 13.8
- Share of female teachers Reliability: Moderate reliability.
- 82%
- Teacher turnover Reliability: Moderate reliability.
- 14%
Moderate reliability — Mixed sources: certification + student/teacher ratio reported directly to Skolverket; other personnel fields from Skolverket's annual Personal report (1-2 year data lag).
Value-added / SALSA
+20.0SALSA residualModel prediction: 267.0 · Actual outcome: 246.0
Value-added / SALSA
+20.0
SALSA residual
The school performs above what the student composition would predict.
- Model prediction Reliability: Moderate reliability.
- 267.0
- Actual outcome Reliability: Moderate reliability.
- 246.0
Moderate reliability — SALSA models have natural uncertainty for small schools.
School environment
Safety & Inspection
1 openRecently inspected 2018Safety index: 80 / 100
Safety & Inspection
1 open
Recently inspected 2018
1 open remark(s) from the Schools Inspectorate.
- Latest inspection decision Reliability: High reliability.
- 2018-06-04 — Regelb. tillsyn Skolbeslut Kungsbacka Onsala Montessoriskola, 2018, 2018 (pdf, 3338 kB)
- Open remarks Reliability: High reliability.
- 1
- Safety index Reliability: High reliability.
- 80 / 100Safety: 87% · Study peace: 71% · Anti-bullying: 77% · Staff: 81%
Safety index
80/ 100(High data coverage)
- Safety87%(national 78)
- Study peace71%(national 56)
- Anti-bullying77%(national 56)
- Staff81%(no national figure)
School Survey — all perspectives
| Dimension | Pupils (åk 8) | Guardian | Staff |
|---|---|---|---|
| Safety | 8.7 / 10 | — | — |
| Study environment | 7.1 / 10 | — | — |
| Anti-bullying | 7.7 / 10 | — | — |
| Stimulation | 7.0 / 10 | — | — |
| Support | 8.2 / 10 | — | — |
Scale 0–10 (rescaled from Skolverket's 0–100). Guardian and staff perspectives are often not in open data.
High reliability — Inspection register and Skolenkäten survey.
Source: Schools Inspectorate + Skolverket · Last updated: 5 Jul 2026
Resources
134,283 SEKCost per pupil (total)Sweden: 144,179 SEK
Resources
134,283 SEK
Cost per pupil (total)
Cost per pupil is 7% below the national average.
Limited history — Cost data updated annually by Kolada/SCB.
Who runs the school
Operator
Gottskär Grundskola Ekonomisk föreningIndependent operator159 other schools in the municipality.
Operator
Gottskär Grundskola Ekonomisk förening
Independent operator
Gottskär Grundskola Ekonomisk förening operates this school independently.
- Operator Reliability: High reliability.
- Gottskär Grundskola Ekonomisk förening
- Operating form Reliability: High reliability.
- Independent
- Other schools in municipality Reliability: High reliability.
- 159
High reliability — Current data from Skolverket and Bolagsverket.
Source: Skolverket · Last updated: 5 Jul 2026
Next step: Apply for a place
Apply through Kungsbacka e-service for school choice.
Contact and address
- Headmaster
- Malin Hammer
- Visiting address
- Landstormsvägen 37, 43993 Onsala
- Postal address
- Landstormsvägen 37, 43994 ONSALA
- Phone
- 0300-61060
- Website
- www.gottskargrundskola.se/
- School unit code
90784555
Source: Skolverket School Unit Register · Pipeline-fetched on 2026-07-05.
Everyday travelAreas that reach the school within 15 minutes.
Reachability from the school
15 min on foot
15 min by bike
School
Support and inclusion
Support and student health
This panel shows sourced support-resource data where available and marks the rest as missing or uncertain. These fields do not affect score or ranking.
Missing or uncertain support-resource fields
- MissingStudent health teamIs there sourced information about student health functions at the school?
- MissingSpecial educatorIs special-education competence reported separately?
- MissingSpecial needs teacherAre special needs teachers reported separately?
- MissingSpecial education competenceIs there a verifiable aggregate metric for special education teachers?
- MissingSchool nurseIs there sourced information about school nurse resources?
- MissingPsychologistIs there sourced information about psychologist resources?
- MissingStudy and career guidanceIs there sourced information about study and career guidance?
- MissingLanguage supportIs there sourced information about language or mother-tongue support?
- MissingAdaptations and special supportIs there verified process information for adaptations and special support?
- MissingAccessibilityIs there sourced information about physical or pedagogical accessibility?
- MissingContact routeIs there a verified contact route for support questions?
Privacy rule: no individual pupil health, diagnosis, support decision or personal case data may be stored.
Daily-life profile
Everyday life at the school
Everyday facts are shown with a source where available. Fields not yet collected are listed together and do not affect score or ranking.
Not collected yet: School day times, After-school care, Language choices, Food and dining, Facilities and outdoor environment, Homework and study support. Suggest an addition →
Nearest and similar schools
- Presseskolan F-35 km away· 180 pupils
- Fjärås Bräckaskolan Terra 3-513 km away· 200 pupils
- Åsaskolan F-37 km away· 180 pupils

About Kungsbacka municipality
School-form averages across the municipality, with links to deep-dive sub-pages.
- Schools
- 160
- Avg. merit (yr 9)
- 240.1+12.4
- Certified teachers
- 77%+3 pp
- Pupils per teacher
- 13.2+1.2
Source: Skolverket (aggregated school statistics).
Similar schools
The 5 most-similar compulsory schools based on student count, geography, teacher certification and pupil composition.
Grade distribution
Share of pupils per grade, school year 2024/25.
−0.3Grades close to national-test results — no clear inflation signal.
Source: SIRIS/Skolverket · See full A–F distribution in the data view →
SALSA result
+20.0A statistical model that compares schools’ results with what is expected given the student composition.Read more in glossary →Performs as expectedThe residual is actual minus expected merit value; positive means the school lifts pupils more than the model predicts.
How should SALSA be read?
SALSA is a statistical comparison metric, not a school rating. Small cohorts and individual year groups can create uncertain signals, so read it together with pupil counts, survey data and other sources.
Source: Skolverket/SALSA · See the full comparison table →
Pupils per year
Number of pupils per year group (total 196 pupils). Latest available year from Skolverket (SIRIS).
★ Watch Gottskär Grundskola
Get email when new statistics are published, merit value changes significantly or the School Inspectorate makes a new decision.
Want to dig deeper?
The Data view shows complete history, sources, methodology and CSV export.
In-depth metrics
Staff stability
Improving
Source: Kolada (municipality-aggregated certified teacher trend).
Throughput year 6 → year 9
69.2% → 100.0%
- 21 pupils yr 6
- 23 pupils yr 9
Source: Skolverket SIRIS + Skolverket Statistical Database.
Safety and study environment (SkolenkätenThe Schools Inspectorate’s survey sent to pupils, parents, and staff about safety, classroom order, and teaching.Read more in glossary →)
The school survey shows pupil experience where responses are available. Read values together with year, response coverage and unknowns.
Coverage: 2 displayed year groups · year 2026.
Strongest (Year 5)
- Safety: 88 (national 82)
- Support: 77 (national 74)
Weakest (Year 5)
- Study environment: 53 (national 57)
- Stimulation: 71 (national 66)
Support-needs policy · School-choice guide
Source: Skolinspektionen Skolenkäten 2026. Updated annually. · See all years and dimensions in the data view →
School meals
Weekly menus and meal provider for this school's municipality.
No menu provider registered for this municipality yet.
Source: municipality's own meal portal — Skolkoll does not host menu content.
Inspections & decisions
Source: Skolinspektionen tillsynsregister (open data). Updated when new decisions are published. · See all decisions and review types in the data view → · Check current status at the Schools Inspectorate ↗
Explore further
More context about Gottskär Grundskola, its municipality, operator and similar schools.
Compulsory schools in KungsbackaSee all compulsory schools in the municipality with results and comparisons.Schools in KungsbackaOpen the municipality page with all schools, rankings, and local aggregates.Gottskär Grundskola Ekonomisk föreningSee all schools, municipalities, and core metrics for the same provider.Hallands länCompare municipalities and school patterns across the whole county.Merit value year 9Compare year-9 merit values across municipalities and school environments.Certification vs Merit valueSee how merit values and upper-secondary eligibility move together.School size by school typeSee how school forms and unit sizes are distributed nationally.School type distributionCompare how school forms are distributed across municipalities and operators.
Data coverage
What we do not know about Gottskär Grundskola
Open school data is not complete. Use this as a checklist for what to verify with the school, provider or municipality.
- HighResults and score inputsHigh data coverage: 4 of 5 score dimensions have school-specific data. When school-specific data is missing for a dimension, the neutral value 50 is used. That does not automatically lower the school, but it makes the score less informative.
- HighEligibility and goal attainmentGrades, eligibility and goal-attainment data may be missing, suppressed or available only for some grades and school types.
- PartialResources, teachers and staffTeacher and resource metrics do not always show subject mix, vacancies, student-health workflows or everyday staffing.
- PartialSupport resources and student healthSome support-resource fields have sourced statistics, but several parts are still missing or reported only in aggregate.
- PartialSafety and study environmentThe school survey is shown where available, but not every grade and perspective is always covered.
- UncertainAdmissions, placement and important datesMunicipal placement rules, queues and important dates require a local source and should be checked with the municipality or school.
- MissingVisits, facilities and everyday environmentWe lack sourced open-house information for this school. Facilities, accessibility and everyday environment are often not open comparable data.
For the school: get your Skolkoll badge
Work at this school? Embed an image showing the school's Skolkoll score that links to the full profile. The image is served from Skolkoll's image host and updates when we publish a new badge for the school.
See Data view for full sources and fetch dates per source.