Dormsjöskolan/grundskola in Hedemora
Part of group: Stiftelsen Dormsjöskolan
Headmaster: Torbjörn Persson
50
Skolkoll Score 50 out of 100. The scale goes from 0 (lowest) to 100 (highest). 50 is the average. This school performs near average.Near averageCompared to all compulsory schools nationally
Limited confidence: the sample is small, so the score may vary more than usual.
A composite of five open data sources — a starting point, not a grade.
Data coverageMedium3/5
Why this score?
Skolkoll score is Skolkoll's composite indicator based on available data sources. It is not an official quality measure and should be read together with the underlying data.
3 of 5 score dimensions have school-specific data. The pupil sample is limited.
When school-specific data is missing for a dimension, the neutral value 50 is used. That does not automatically lower the school, but it makes the score less informative.
Dormsjöskolan/grundskola is a small group-operated compulsory school with 10 pupils.
Dormsjöskolan/grundskola is a small group-operated compulsory school with 10 pupils. The share of qualified teachers (57%) is below the national average of 72%.
- 10PupilsMunicipality: 1,460High reliability
- 57%Qualified teachersMunicipality: 66% · Sweden: 72%High reliability
- 1.8Pupils per teacherMunicipality: 10.5 · Sweden: 12.0High reliability
- 140,975 SEKCost per pupil (municipal avg.)Sweden: 144,179 SEKLimited history
See how schools in Hedemora rank →
The most important facts in 3 points
- Adapted compulsory school in Hedemora with 10 pupils.
- The latest record (2009) is a review or decision without risk classification.
- Applying? Go to the school's application link on this page.
Skolkoll interpretation
Dormsjöskolan/grundskola is compared here with 9 other schools with the same school form in Hedemora municipality; it has 10 pupils versus the municipal average of 146.
Qualified teachers: 57%, 9 percentage points below the municipal average and 15 percentage points below the national average.
Pupils per teacher is 1.8, 8.7 lower than the municipal average.
Apply for a place? Use Hedemora e-service for school choice (opens in a new window).
3 values is hidden for privacy reasons
This applies only to the values listed here.
Skolverket withholds values for groups with fewer than 10 students (Swedish privacy law).
This affects
- Eligible for vocational programmes
- Merit score year 9
- SALSA score
- This result metric can be affected by privacy suppression, small cohorts, and changes in pupil composition between years.
- SALSA is model-based and becomes less stable for small pupil groups or schools with rapidly changing pupil composition.
Other values here do not have this specific note.
School programmes
- Compulsory school
Things to look into
Worth looking into. These indicators are an attention aid, not a quality grade or risk score.
- 57% qualified teachers — more than 10 percentage points below the national average (72%).
School profile
The school's strengths compared with all primary schools nationally.
- Certified teachersP12
- Pupil-teacher ratioP100
Source: Skolverket, Swedish Schools Inspectorate.
Aerial view of the school
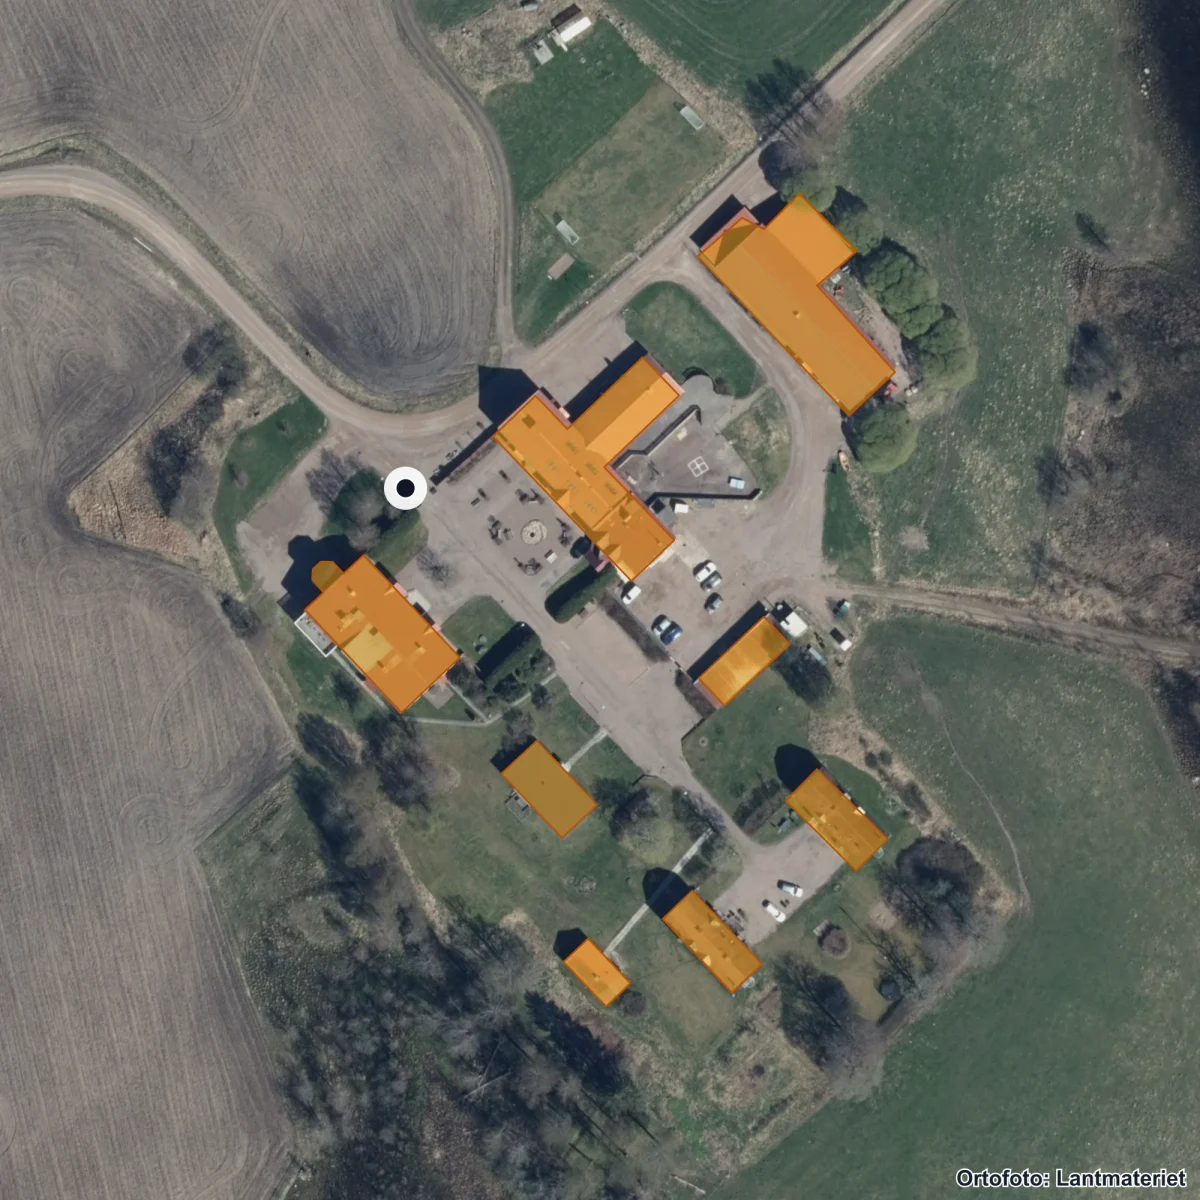
Aerial view of the school's surroundings. The property is marked from the register; building use has not been verified. Updated 2026. Source: Lantmäteriet · CC BY 4.0
Entrances:1 Hedemora, Dormsjö 214, Garpenberg
School performance
Staff
57%Qualified teachersMunicipality: 66% · Sweden: 72%
Staff
57%
Qualified teachers
57% of teachers hold a pedagogical degree — 15 percentage points below the national average.
- Qualified teachers Reliability: High reliability.
- 57%From 59% (2425) to 57% (2526)Single cohort, uncertain basisMunicipality: 66% · Sweden: 72%
- Pupils per teacher Reliability: High reliability.
- 1.8From 1.4 (2425) to 1.8 (2526)Single cohort, uncertain basisMunicipality: 10.5 · Sweden: 12.0
- Permanently employed Reliability: Moderate reliability.
- 100%
- Senior teachers (förstelärare) Reliability: Moderate reliability.
- —Data missing — the Swedish National Agency for Education has not published this value.
- Certified in their teaching subject Reliability: Moderate reliability.
- 59%
- Teachers (FTE) Reliability: Moderate reliability.
- 6.4
- Share of female teachers Reliability: Moderate reliability.
- 47%
- Teacher turnover Reliability: Moderate reliability.
- 1%
Moderate reliability — Mixed sources: certification + student/teacher ratio reported directly to Skolverket; other personnel fields from Skolverket's annual Personal report (1-2 year data lag).
School environment
Safety & Inspection
No active casesRecently inspected 2009Safety index: 77 / 100
Safety & Inspection
No active cases
Recently inspected 2009
No open remarks from the Schools Inspectorate. Latest decision: Regelb. tillsyn Hedemora Dormsjöskolan/grundskola, 2009 (pdf, 534 kB).
- Latest inspection decision Reliability: High reliability.
- 2009-11-09 — Regelb. tillsyn Hedemora Dormsjöskolan/grundskola, 2009 (pdf, 534 kB)
- Open remarks Reliability: High reliability.
- 0
- Safety index Reliability: Moderate reliability.
- 77 / 100Staff: 77%
Safety index
77/ 100(Low data coverage)
- Staff77%(no national figure)
Moderate reliability — Inspection register and Skolenkäten survey.
Source: Schools Inspectorate + Skolverket · Last updated: 5 Jul 2026
Resources
140,975 SEKCost per pupil (total)Sweden: 144,179 SEK
Resources
140,975 SEK
Cost per pupil (total)
Cost per pupil is 2% below the national average.
Limited history — Cost data updated annually by Kolada/SCB.
Who runs the school
Operator
Stiftelsen DormsjöskolanGroup operator28 other schools in the municipality.
Operator
Stiftelsen Dormsjöskolan
Group operator
Stiftelsen Dormsjöskolan operates this school as part of a larger concern.
- Operator Reliability: High reliability.
- Stiftelsen Dormsjöskolan
- Operating form Reliability: High reliability.
- Group-operated
- Concern (parent organisation) Reliability: High reliability.
- Stiftelsen Dormsjöskolan
- Concern org. number Reliability: High reliability.
- 8820000365
- Other schools in municipality Reliability: High reliability.
- 28
High reliability — Current data from Skolverket and Bolagsverket.
Source: Skolverket · Last updated: 5 Jul 2026
Next step: Apply for a place
Apply through Hedemora e-service for school choice.
Contact and address
- Headmaster
- Torbjörn Persson
- Visiting address
- Dormsjö 214, 77698 Garpenberg
- Postal address
- Dormsjö 214, 77698 GARPENBERG
- Phone
- 0225-710756
- Website
- www.dormsjoskolan.com/
- School unit code
36022766
Source: Skolverket School Unit Register · Pipeline-fetched on 2026-07-05.
Everyday travelAreas that reach the school within 15 minutes.
Reachability from the school
15 min on foot
15 min by bike
School
Daily-life profile
Everyday life at the school
Everyday facts are shown with a source where available. Fields not yet collected are listed together and do not affect score or ranking.
Not collected yet: School day times, After-school care, Language choices, Food and dining, Facilities and outdoor environment, Homework and study support. Suggest an addition →
Nearest and similar schools
- Annaskolan0 km away· 80 pupils
- Nordanö skola23 km away· 30 pupils
- Fors skola18 km away· 110 pupils
About Hedemora municipality
School-form averages across the municipality, with links to deep-dive sub-pages.
- Schools
- 29
- Avg. merit (yr 9)
- 201.7−26.0
- Certified teachers
- 67%−7 pp
- Pupils per teacher
- 10.4−1.6
Source: Skolverket (aggregated school statistics).
Similar schools
The 5 most-similar compulsory schools based on student count, geography, teacher certification and pupil composition.
Pupils per year
Number of pupils per year group (total 12 pupils). Latest available year from Skolverket (SIRIS).
★ Watch Dormsjöskolan/grundskola
Get email when new statistics are published, merit value changes significantly or the School Inspectorate makes a new decision.
Want to dig deeper?
The Data view shows complete history, sources, methodology and CSV export.
In-depth metrics
Staff stability
Improving
Source: Kolada (municipality-aggregated certified teacher trend).
School meals
Weekly menus and meal provider for this school's municipality.
No menu provider registered for this municipality yet.
Source: municipality's own meal portal — Skolkoll does not host menu content.
Inspections & decisions
The Schools Inspectorate has 2 decisions on record without critical findings. Most recent: Nov 2009.
Source: Skolinspektionen tillsynsregister (open data). Updated when new decisions are published. · See all decisions and review types in the data view → · Check current status at the Schools Inspectorate ↗
Explore further
More context about Dormsjöskolan/grundskola, its municipality, operator and similar schools.
Compulsory schools in HedemoraSee all compulsory schools in the municipality with results and comparisons.Schools in HedemoraOpen the municipality page with all schools, rankings, and local aggregates.AB DormsjöskolanSee all schools, municipalities, and core metrics for the same provider.Stiftelsen DormsjöskolanOpen the full school-group page with providers, municipalities, and group totals.Dalarnas länCompare municipalities and school patterns across the whole county.Merit value year 9Compare year-9 merit values across municipalities and school environments.Certification vs Merit valueSee how merit values and upper-secondary eligibility move together.Compare schoolsBuild a side-by-side comparison with the schools you care about.
Data coverage
What we do not know about Dormsjöskolan/grundskola
Open school data is not complete. Use this as a checklist for what to verify with the school, provider or municipality.
- MediumResults and score inputsMedium data coverage: 3 of 5 score dimensions have school-specific data. The pupil sample is limited. When school-specific data is missing for a dimension, the neutral value 50 is used. That does not automatically lower the school, but it makes the score less informative.
- MediumEligibility and goal attainmentGrades, eligibility and goal-attainment data may be missing, suppressed or available only for some grades and school types.
- UncertainResources, teachers and staffTeacher and resource metrics do not always show subject mix, vacancies, student-health workflows or everyday staffing.
- MissingSupport resources and student healthWe do not yet have a verified national data source for special education, student health, adaptations, language support or contact routes per school.
- MissingSafety and study environmentWe lack current or displayable survey data about safety and study environment for this school.
- UncertainAdmissions, placement and important datesMunicipal placement rules, queues and important dates require a local source and should be checked with the municipality or school.
- MissingVisits, facilities and everyday environmentWe lack sourced open-house information for this school. Facilities, accessibility and everyday environment are often not open comparable data.
See Data view for full sources and fetch dates per source.