
Staff stability
Improving
Source: Kolada (municipality-aggregated certified teacher trend).
Headmaster: Corina Rader
Foto: Andacbaran · CC BY-SA 4.0 · Wikimedia Commons · Modifierad
AI-stylised illustration, not a photo of the school.
Skolkoll's adaptation is shared under CC BY-SA 4.0.
Report an issue with this imageBritish International School is a medium-sized independent upper secondary school with 280 pupils.
British International School is a medium-sized independent upper secondary school with 280 pupils.
British International School is compared here with 3 other schools with the same school form in Danderyd municipality; it has 280 pupils versus the municipal average of 673.
Pupils per teacher is 12.1, 3.4 lower than the municipal average.
Apply for a place? Use Danderyd e-service for school choice (opens in a new window).
Apply for a place? Use Danderyd e-service for upper-secondary application (opens in a new window).
This applies only to the values listed here.
This value is missing in full or in part.
This affects
Other values here do not have this specific note.
No clear attention flags from key-figure deviations or the School Inspectorate's public register. Detailed inspection history is shown in the "Safety & Inspection" card below.
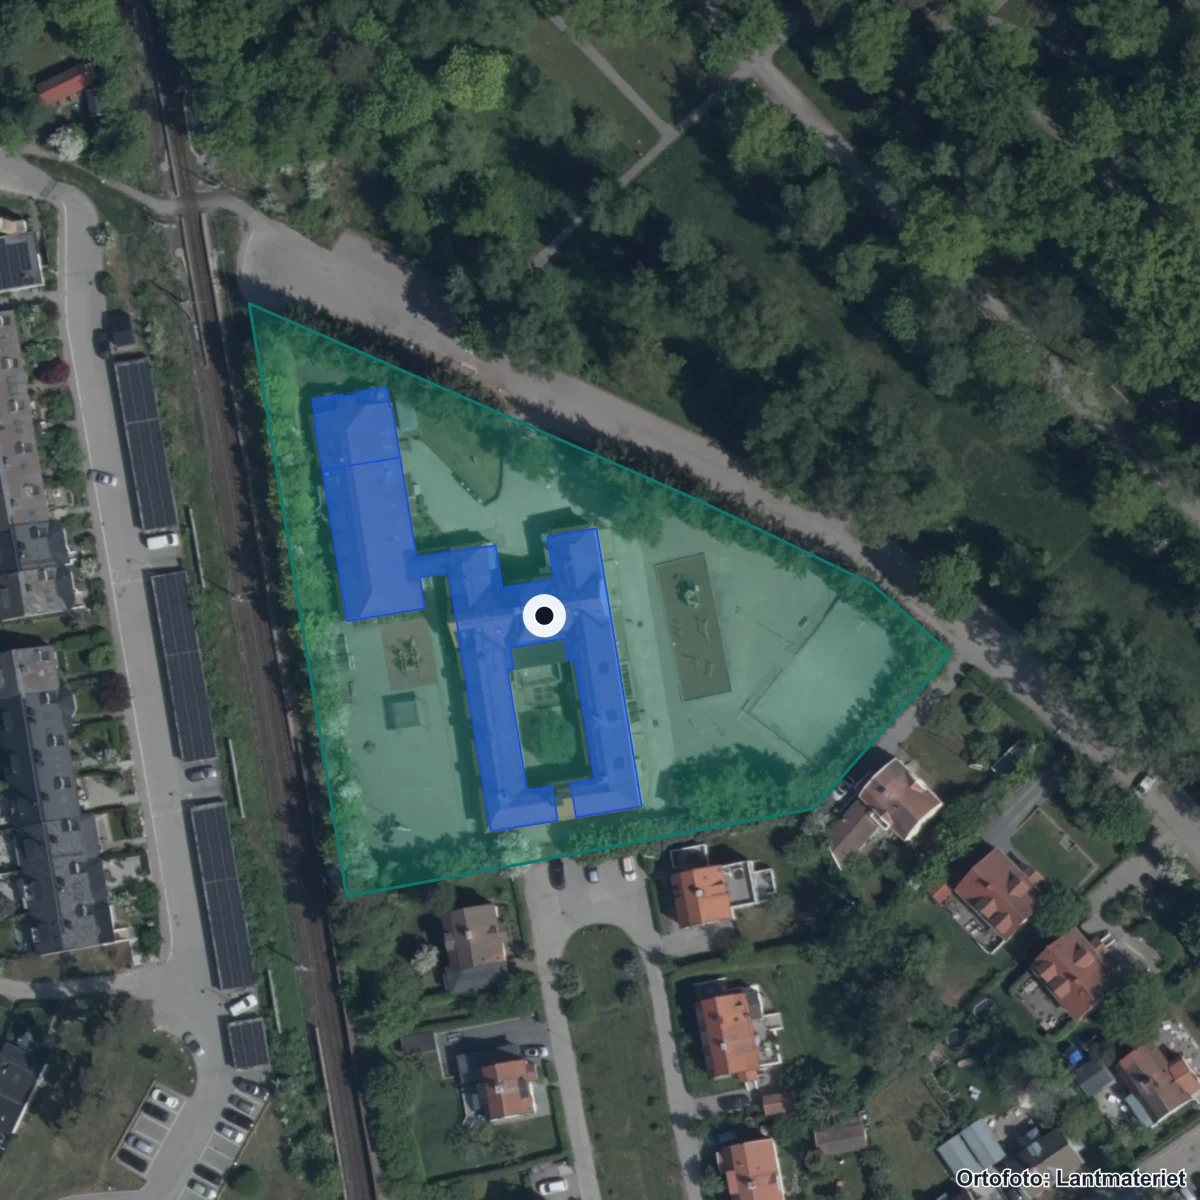
The school's property boundary and buildings from the Swedish Land Survey's property register. Updated 2026. Source: Lantmäteriet · CC BY 4.0
Entrances:1 Danderyd, Östra Valhallavägen 17, Djursholm
Municipality: 15.5 · Sweden: 12.1
Staff data reported by the school operator.
No open remarks from the Schools Inspectorate. Latest decision: Regelb. tillsyn Skolbeslut Danderyd British International School, 2018 (pdf, 226 kB).
Source: Schools Inspectorate + Skolverket · Last updated: 5 Jul 2026
Sweden: 144,179 SEK
Cost per pupil is 6% below the national average.
48 other schools in the municipality.
STIFTELSEN BORGEN 2 - BRITISH INTERNATIONAL SCHOOL STOCKHOLM operates this school independently.
Source: Skolverket · Last updated: 5 Jul 2026
Apply through Danderyd e-service for school choice.
Apply through Danderyd e-service for upper-secondary application.
66620411Source: Skolverket School Unit Register · Pipeline-fetched on 2026-07-05.
Everyday travelAreas that reach the school within 15 minutes.
School-form averages across the municipality, with links to deep-dive sub-pages.
Source: Skolverket (aggregated school statistics).
The 5 most-similar upper secondary schools based on student count, geography, teacher certification and pupil composition.
Number of pupils per year group (total 281 pupils). Latest available year from Skolverket (SIRIS).
Get email when new statistics are published, merit value changes significantly or the School Inspectorate makes a new decision.
The Data view shows complete history, sources, methodology and CSV export.
Source: Kolada (municipality-aggregated certified teacher trend).
Weekly menus and meal provider for this school's municipality.
No menu provider registered for this municipality yet.
Source: municipality's own meal portal — Skolkoll does not host menu content.
The Schools Inspectorate has 1 decision on record without critical findings.
Source: Skolinspektionen tillsynsregister (open data). Updated when new decisions are published. · See all decisions and review types in the data view → · Check current status at the Schools Inspectorate ↗
Applicants per place and latest admission cutoff per programme (2026).
High demand reflects popularity, which depends on location and reputation as well as quality. Cutoffs measure entry difficulty, not school quality.
Source: Gymnasieantagningen (regional admission databases). Latest year: 2026.
More context about British International School, its municipality, operator and similar schools.
Data coverage
Open school data is not complete. Use this as a checklist for what to verify with the school, provider or municipality.
See Data view for full sources and fetch dates per source.